Solar Wind clean Mod1
Download script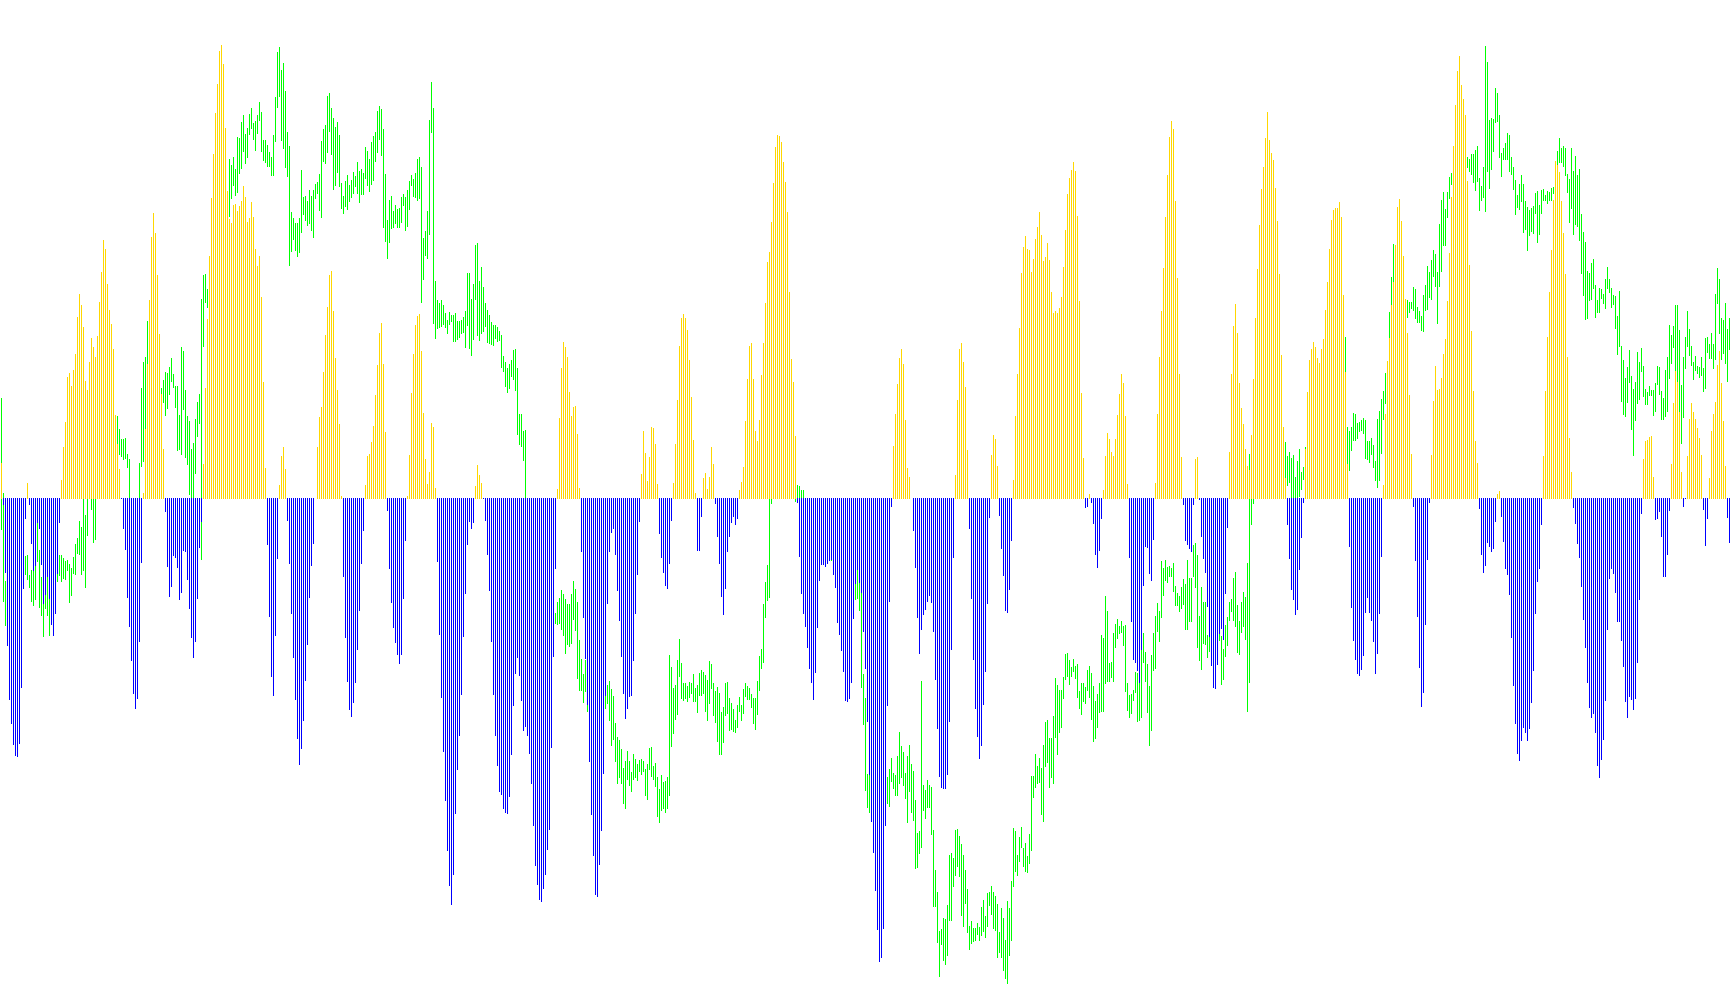
This technical indicator is designed to analyze price action by measuring the relative position of the current market price within a specific historical range. It acts as a momentum and trend oscillator, providing visual feedback on whether the market is leaning toward overbought or oversold conditions based on recent volatility.
Core Logic and Mechanics
1. Range Identification The script looks at a defined number of previous bars (the "period"). Within this window, it identifies two key levels: the highest price reached and the lowest price reached. These two points establish the boundaries of the current market's immediate range.
2. Relative Price Positioning For every new candle, the script calculates the midpoint of the current price. It then determines where this midpoint sits relative to the high and low boundaries found in the previous step. By calculating this percentage, the tool can "score" the current market position:
- If the price is closer to the top of the range, the score moves toward a positive value.
- If the price is closer to the bottom of the range, the score moves toward a negative value.
3. Smoothing and Weighting To prevent the indicator from reacting erratically to tiny, instantaneous price flickers, the script applies a weighted smoothing process. It combines the current price position with the previous result, giving more weight to the most recent data while maintaining a "memory" of the prior movement. This ensures that the resulting line flows smoothly across your chart rather than jumping unpredictably.
4. Logarithmic Conversion and Normalization The script uses a mathematical conversion (logarithmic) to translate these smoothed scores into a specific visual scale. It also includes a safety mechanism that caps the values to ensure they stay within a consistent boundary, preventing extreme outliers from distorting the visual representation.
5. Visual Output The final result is displayed as a histogram in a separate window below your main price chart. The logic splits the output into two distinct colors:
- Positive Sentiment: When the calculated momentum is above zero, the indicator displays a primary value (typically represented in Lime).
- Negative Sentiment: When the momentum drops below zero, the indicator shifts its primary display to the opposite side (typically represented in Red).
In essence, this tool helps traders visualize the "tug-of-war" between buyers and sellers by showing how aggressively the price is pushing toward one end of its recent trading range versus the other.
#property  copyright ""
#property  link      ""

#property  indicator_separate_window
#property  indicator_buffers 2
#property  indicator_color1  Lime
#property  indicator_color2  Red

extern int period=10;

double         ExtBuffer0[];
double         ExtBuffer1[];
double         ExtBuffer2[];
double         Value[];


int init()
{
   IndicatorBuffers(4);
   SetIndexBuffer(0,ExtBuffer1);
   SetIndexBuffer(1,ExtBuffer2);
   SetIndexBuffer(2,ExtBuffer0);
   SetIndexBuffer(3,Value);

   SetIndexStyle(0,DRAW_HISTOGRAM);
   SetIndexStyle(1,DRAW_HISTOGRAM);

//--- slight mod to show currency pair and Period
//--- by nittany1 on forex-tsd, hope this helps

   IndicatorShortName("SOLAR WIND Clean Mod1 ("+Symbol()+","+period+")");
   IndicatorDigits(Digits+1);
   return(0);
}


int start()
{
   int   limit;
   int   counted_bars=IndicatorCounted();

   if(counted_bars>0) counted_bars--;
           limit=Bars-counted_bars;

   for(int i=limit; i>=0; i--)
   {
      double MaxH  = High[iHighest(NULL,0,MODE_HIGH,period,i)];
      double MinL  = Low [iLowest( NULL,0,MODE_LOW, period,i)];
      double price = (High[i]+Low[i])/2;
      if (MaxH!=MinL)
            Value[i] = 0.33*2*((price-MinL)/(MaxH-MinL)-0.5) + 0.67*Value[i+1];
      else  Value[i] = 0.00;
            Value[i] = MathMin(MathMax(Value[i],-0.999),0.999);
            ExtBuffer0[i]=0.5*MathLog((1+Value[i])/(1-Value[i]))+0.5*ExtBuffer0[i+1];

      //
      //
      //
      //
      //

      if(ExtBuffer0[i]<0)
      {
         ExtBuffer2[i]=ExtBuffer0[i];
         ExtBuffer1[i]=0.0;
      }
      else
      {
         ExtBuffer1[i]=ExtBuffer0[i];
         ExtBuffer2[i]=0.0;
      }
   }
   return(0);
}
Comments