SMI_v4
Download script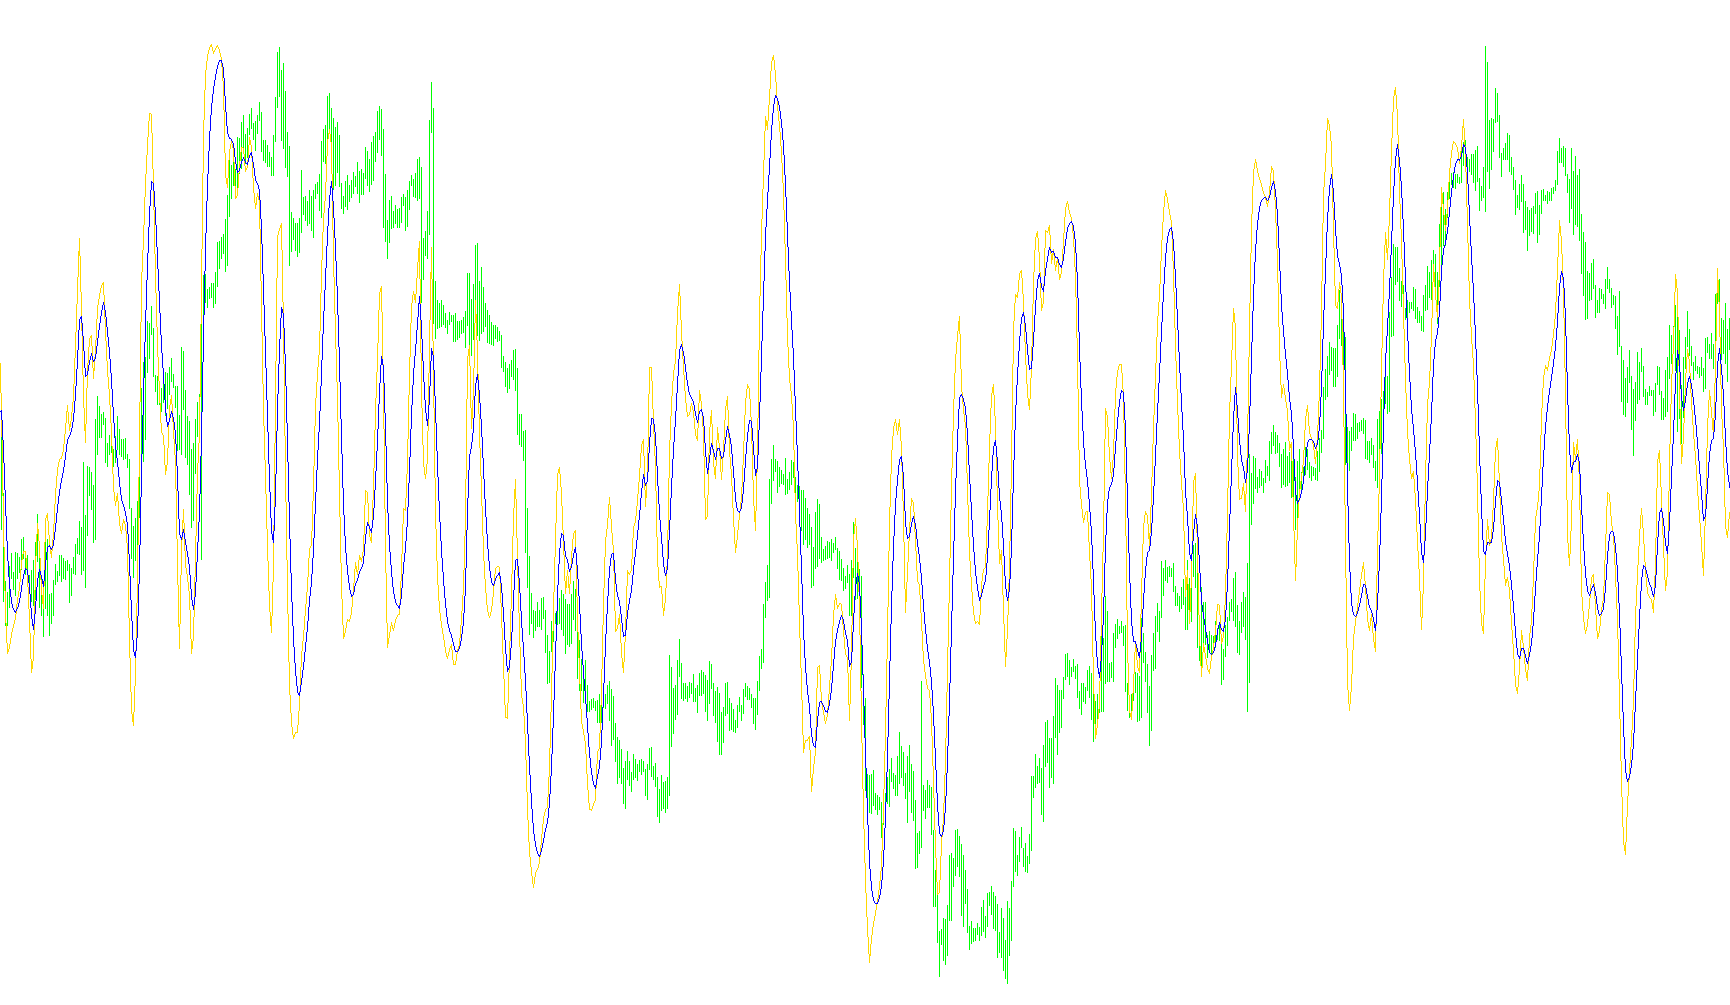
This script functions as a specialized technical analysis tool designed to help traders visualize price momentum and identify potential trends by comparing the relationship between current prices and historical extremes.
How it Works
The logic follows a multi-step mathematical process to filter out market "noise" and highlight significant movement:
1. Identifying Highs and Lows The script first looks at a specific window of recent candles to identify the highest price reached and the lowest price recorded. From these points, it calculates two primary values:
- The Range: The distance between the high and low points.
- The Median Point: The halfway mark between that high and low.
2. Calculating Price Positioning It then determines where the current closing price sits in relation to that median point. This helps the script understand if the price is currently trading significantly above or below its recent "fair value" range.
3. Smoothing the Data Raw market data can be erratic and jumpy. To make the information more readable, the script applies several layers of "Exponential Moving Averages" (EMA). Think of this as a smoothing filter that prevents minor price flickers from creating false signals, ensuring that only sustained movements are highlighted. It performs this smoothing multiple times across different periods to refine the trend even further.
4. Generating the Final Indicators The script produces two main visual lines for the user:
- The SMI Line: This is the primary indicator. It represents a ratio of the smoothed price position compared to the smoothed high-low range. By multiplying this by a scale factor, it creates a clearer visual of whether the market is overextended in one direction or another.
- The Signal Line: This is a secondary, slower line that follows the primary SMI line. It acts as a reference point; when the SMI line crosses this signal line, it often indicates a shift in momentum, helping traders spot potential turning points in the market trend.
Summary for the User
In simple terms, this script takes raw price data, identifies the boundaries of recent price action, and smooths out the fluctuations to show you the "true" direction of the momentum. It helps you see whether the price is pushing aggressively in one direction or if it is starting to lose steam and revert.
//+------------------------------------------------------------------+
//|                                                          SMI.mq4 |
//|                      Copyright © 2005, MetaQuotes Software Corp. |
//|                                        http://www.metaquotes.net |
//+------------------------------------------------------------------+
#property copyright "Copyright © 2005, MetaQuotes Software Corp."
#property link      "http://www.metaquotes.net"
//----
#property indicator_separate_window
#property indicator_buffers 2
#property indicator_color1 White
#property indicator_color2 Red
#property indicator_level1 0
//---- input parameters
extern int       Period_Q=2;
extern int       Period_R=8;
extern int       Period_S=5;
extern int       Signal=5;
//---- buffers
double SMI_Buffer[];
double Signal_Buffer[];
double SM_Buffer[];
double EMA_SM[];
double EMA2_SM[];
double EMA_HQ[];
double EMA2_HQ[];
double HQ_Buffer[];
//+------------------------------------------------------------------+
//| Custom indicator initialization function                         |
//+------------------------------------------------------------------+
int init()
  {
//---- indicators
   IndicatorBuffers(8);
   SetIndexStyle(0,DRAW_LINE);
   SetIndexBuffer(0,SMI_Buffer);
   SetIndexStyle(1,DRAW_LINE);
   SetIndexBuffer(1,Signal_Buffer);
   SetIndexLabel(0,"SMI");
   SetIndexLabel(1,"Signal SMI");
   SetIndexBuffer(2,SM_Buffer);
   SetIndexBuffer(3,EMA_SM);
   SetIndexBuffer(4,EMA2_SM);
   SetIndexBuffer(5,EMA_HQ);
   SetIndexBuffer(6,EMA2_HQ);
   SetIndexBuffer(7,HQ_Buffer);
   IndicatorShortName("SMI("+Period_Q+","+Period_R+","+Period_S+","+Signal+")");
//----
   return(0);
  }
//+------------------------------------------------------------------+
//| Custor indicator deinitialization function                       |
//+------------------------------------------------------------------+
int deinit()
  {
//---- TODO: add your code here
//----
   return(0);
  }
//+------------------------------------------------------------------+
//| Custom indicator iteration function                              |
//+------------------------------------------------------------------+
int start()
  {
   int    counted_bars=IndicatorCounted();
   int limit;
   int i;
   //   double Median_Q[];
   if(counted_bars<0) return(-1);
   if(counted_bars>0) counted_bars--;
   limit=Bars-Period_Q-counted_bars;
   if(counted_bars>0) counted_bars--;
   //   ArrayResize(Median_Q,limit);
   //   ArrayResize(HQ_Buffer,limit);
   //   ArraySetAsSeries(Median_Q,true);
   //   ArraySetAsSeries(HQ_Buffer,true);
   for(i=limit;i>=0;i--)
     {
      //Median_Q[i]=(High[Highest(NULL,0,MODE_HIGH,0,i)]+Low[Lowest(NULL,0,MODE_HIGH,0,i)])/2;
      HQ_Buffer[i]=High[Highest(NULL,0,MODE_HIGH,Period_Q,i)]-Low[Lowest(NULL,0,MODE_LOW,Period_Q,i)];
      SM_Buffer[i]=Close[i]-(High[Highest(NULL,0,MODE_HIGH,Period_Q,i)]+Low[Lowest(NULL,0,MODE_LOW,Period_Q,i)])/2;//Median_Q[i];
     }
   //   for (i=limit;i>=0;i--)
   //      {
   //      SM_Buffer[i]=Close[i]-(High[Highest(NULL,0,MODE_HIGH,0,i)]+Low[Lowest(NULL,0,MODE_HIGH,0,i)])/2;//Median_Q[i];
   //      }
   for(i=limit-Period_R;i>=0;i--)
     {
      EMA_SM[i]=iMAOnArray(SM_Buffer,0,Period_R,0,MODE_EMA,i);
      EMA_HQ[i]=iMAOnArray(HQ_Buffer,0,Period_R,0,MODE_EMA,i);
     }
   for(i=limit-Period_R-Period_S;i>=0;i--)
     {
      EMA2_SM[i]=iMAOnArray(EMA_SM,0,Period_S,0,MODE_EMA,i);
      EMA2_HQ[i]=iMAOnArray(EMA_HQ,0,Period_S,0,MODE_EMA,i);
     }
   for(i=limit-Period_R-Period_S-Signal;i>=0;i--)
     {
      SMI_Buffer[i]=100*EMA2_SM[i]/0.5/EMA2_HQ[i];
     }
   for(i=limit-Period_R-Period_S;i>=0;i--)
     {
      Signal_Buffer[i]=iMAOnArray(SMI_Buffer,0,Signal,0,MODE_EMA,i);
     }
//---- TODO: add your code here
//----
   return(0);
  }
//+------------------------------------------------------------------+
Comments