Solar Wind mod1
Download script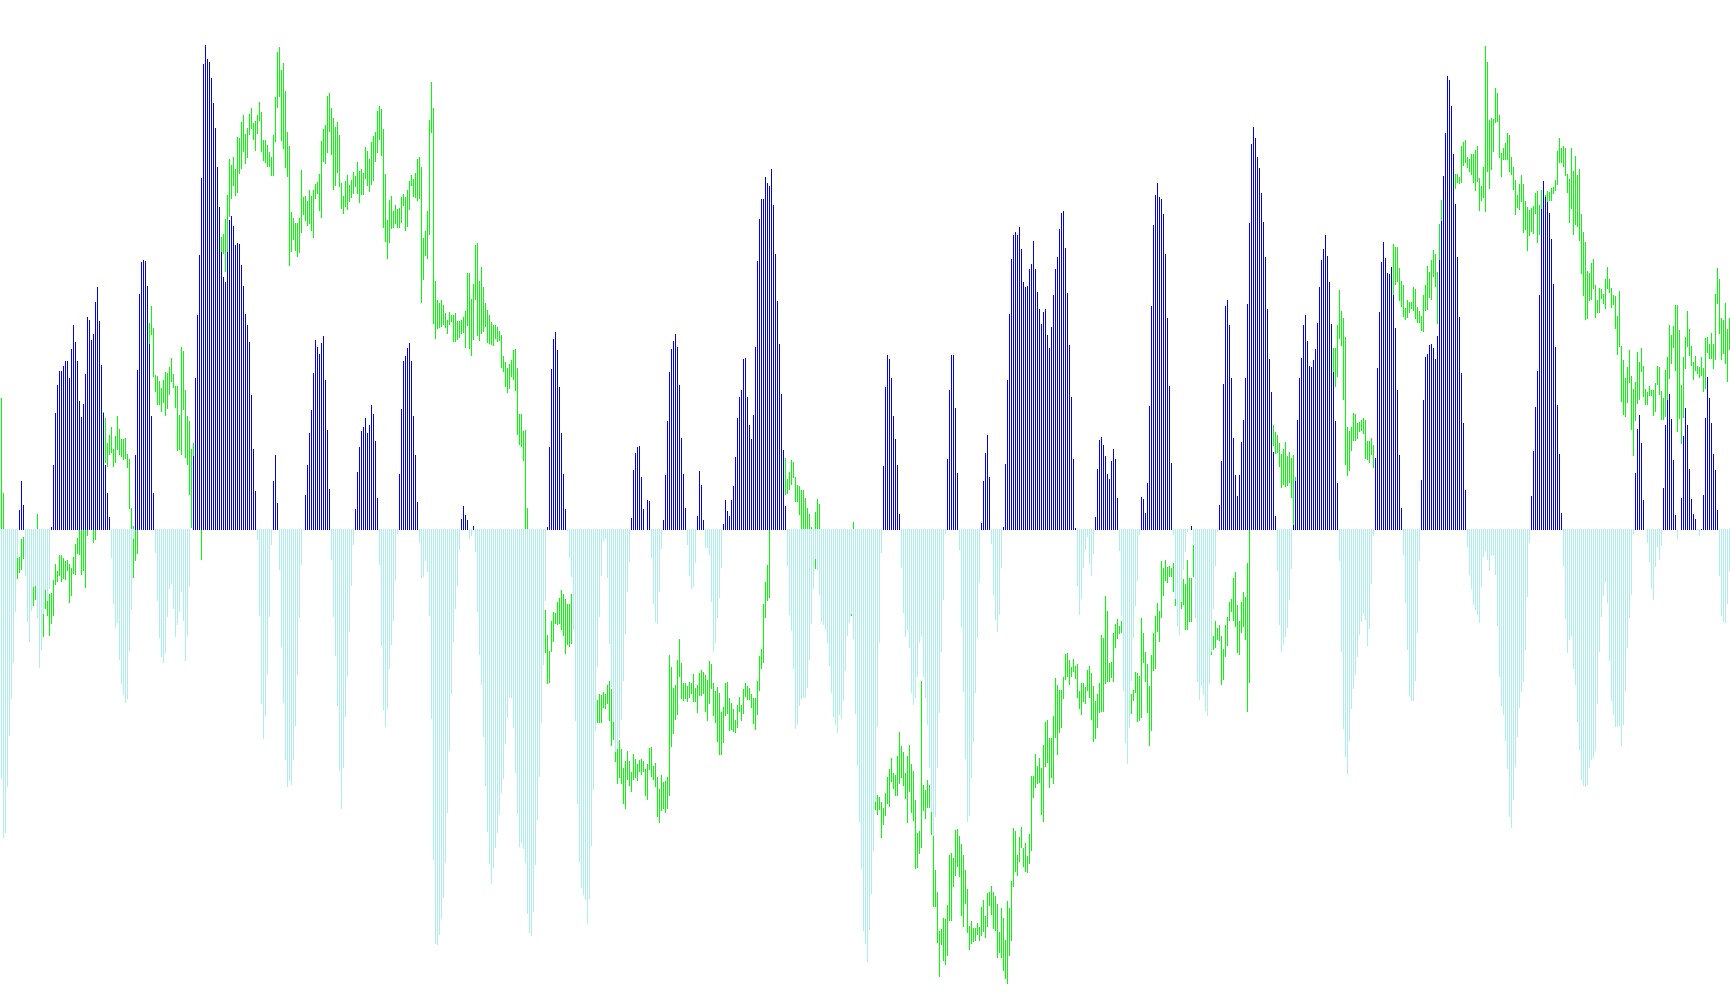
This tool, titled Solar Wind, is a specialized visual indicator designed to analyze market momentum and price trends by smoothing out the inherent "noise" of price movements. Instead of looking at raw price points, it processes data to identify underlying directional shifts.
Core Logic and Data Processing
The script begins by scanning the market over a specific user-defined timeframe (the period). For every interval, it identifies the highest and lowest price points reached. It then calculates a relative position for the current price between those extremes.
This calculation is passed through a smoothing formula that blends the current relative position with previous data. This ensures that the resulting movement isn't erratic; rather, it creates a fluid transition that reflects the overall "flow" of the market. By applying a mathematical limit to these values, the script prevents extreme outliers from distorting the visual trend, keeping the data within a stable range.
Visual Representation and Trend Identification
The indicator translates these smoothed values into a visual histogram displayed in a separate window below the main price chart. Its primary purpose is to distinguish between bullish (upward) and bearish (downward) momentum:
- Momentum Tracking: The tool converts the processed mathematical values into a visual signal. When the data points above the zero line, it suggests upward pressure; when they fall below, it suggests downward pressure.
- Color Coding: To make this easy for a trader to read at a glance, the script uses distinct colors:
- Lime (Green): Highlights periods where the momentum is positive or moving in an upward direction.
- Red: Highlights periods where the momentum is negative or moving in a downward direction.
- Dynamic Switching: The logic specifically looks for "crossover" points—the exact moments when the momentum flips from positive to negative (or vice versa). When a flip occurs, the histogram instantly changes color, providing a clear visual cue of a potential change in market direction.
Summary for the User
Essentially, Solar Wind acts as a filter. It takes the chaotic ups and downs of price action, smoothes them into a continuous wave, and then paints that wave in two colors. This allows you to see the "current" of the market more clearly, helping to identify whether the prevailing trend is moving up or down without being distracted by minor, insignificant price fluctuations.
#property  copyright "Copyright © 2005, Yura Prokofiev"
#property  link      "Yura.prokofiev@gmail.com"

#property  indicator_separate_window
#property  indicator_buffers 3
#property  indicator_color1  Black
#property  indicator_color2  Lime
#property  indicator_color3  Red

extern int period=10;

double         ExtBuffer0[];
double         ExtBuffer1[];
double         ExtBuffer2[];


int init()
  {


   SetIndexStyle(0,DRAW_NONE);
   SetIndexStyle(1,DRAW_HISTOGRAM);
   SetIndexStyle(2,DRAW_HISTOGRAM);
   IndicatorDigits(Digits+1);

   SetIndexBuffer(0,ExtBuffer0);
   SetIndexBuffer(1,ExtBuffer1);
   SetIndexBuffer(2,ExtBuffer2);

//--- slight mod to show currency pair and Period
//--- by nittany1 on forex-tsd, hope this helps

   IndicatorShortName("SOLAR WIND ("+Symbol()+","+period+")");
   SetIndexLabel(1,NULL);
   SetIndexLabel(2,NULL);

   return(0);
  }


int start()
  {
   //int     period=10;
   int    limit;
   int    counted_bars=IndicatorCounted();
   double prev,current,old;
   double Value=0,Value1=0,Value2=0,Fish=0,Fish1=0,Fish2=0;
   double price;
   double MinL=0;
   double MaxH=0;


   if(counted_bars>0) counted_bars--;
   limit=Bars-counted_bars;


   for(int i=0; i<limit; i++)
    {  MaxH = High[Highest(NULL,0,MODE_HIGH,period,i)];
       MinL = Low[Lowest(NULL,0,MODE_LOW,period,i)];
      price = (High[i]+Low[i])/2;
      Value = 0.33*2*((price-MinL)/(MaxH-MinL)-0.5) + 0.67*Value1;
      Value=MathMin(MathMax(Value,-0.999),0.999);
      ExtBuffer0[i]=0.5*MathLog((1+Value)/(1-Value))+0.5*Fish1;
      Value1=Value;
      Fish1=ExtBuffer0[i];

    }


   bool up=true;
   for(i=limit-2; i>=0; i--)
     {
      current=ExtBuffer0[i];
      prev=ExtBuffer0[i+1];

      if (((current<0)&&(prev>0))||(current<0))   up= false;
      if (((current>0)&&(prev<0))||(current>0))   up= true;

      if(!up)
        {
         ExtBuffer2[i]=current;
         ExtBuffer1[i]=0.0;
        }

       else
         {
          ExtBuffer1[i]=current;
          ExtBuffer2[i]=0.0;
         }
     }

   return(0);
  }
Comments