SmoothedAdaptiveMomentum
Download script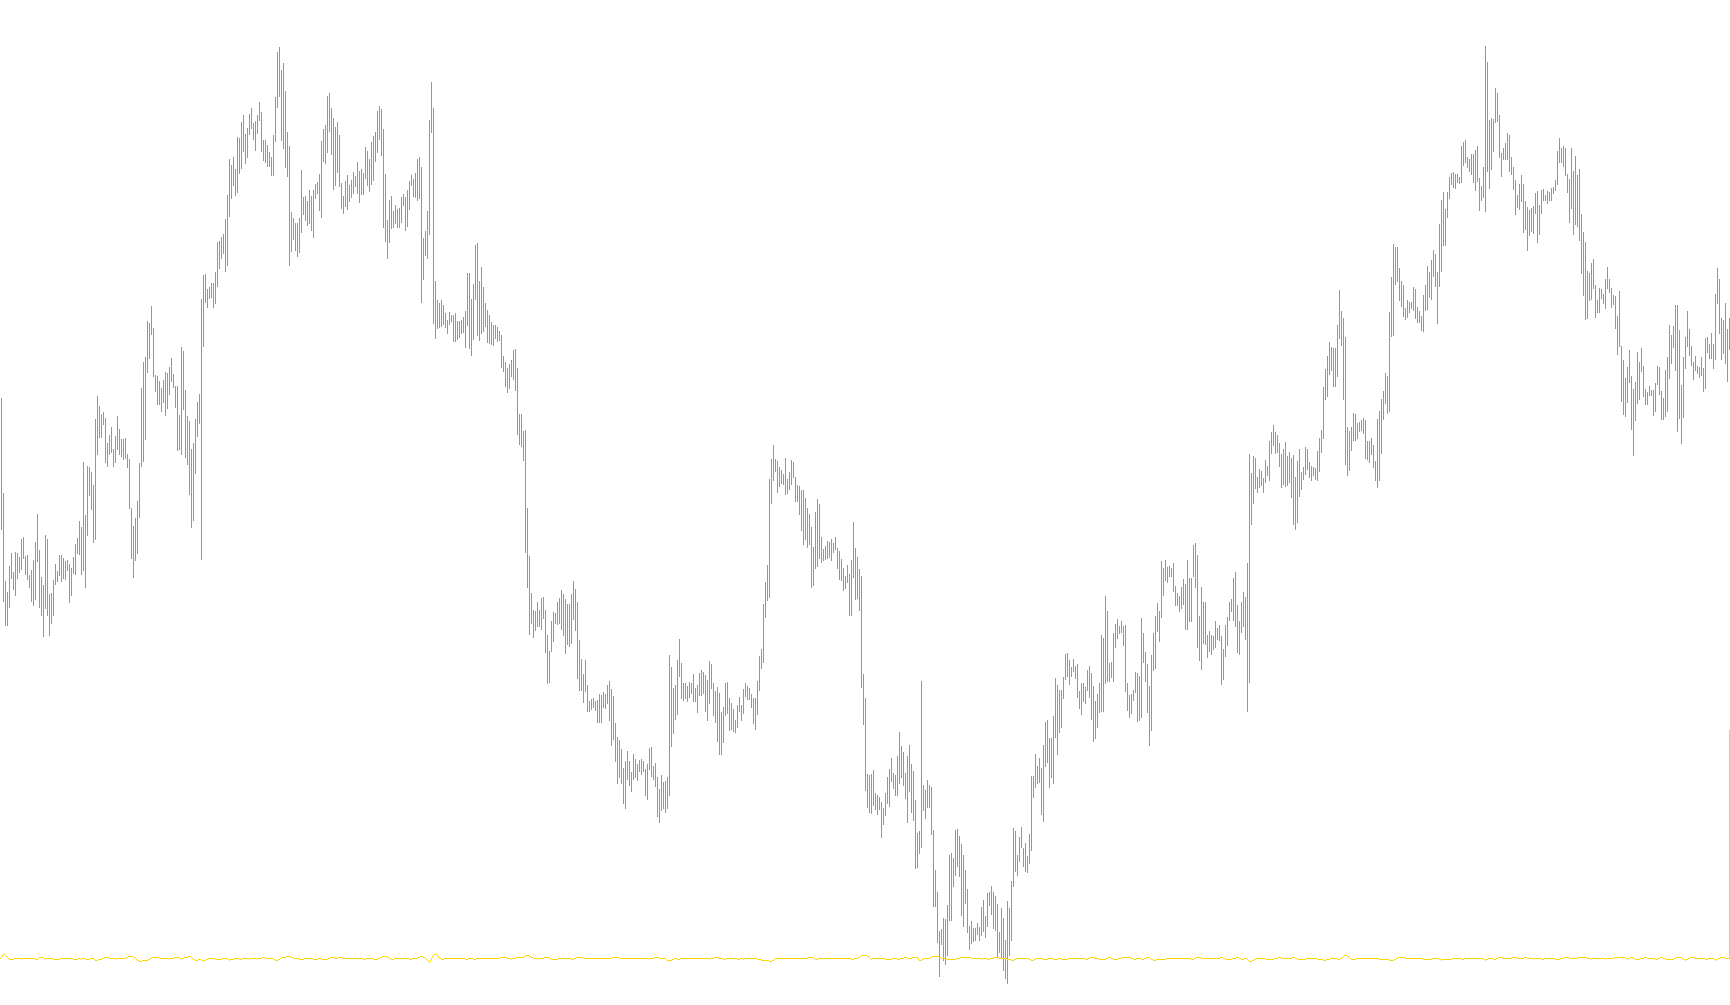
This technical indicator, based on the cybernetics principles of John F. Ehlers, is designed to provide a sophisticated view of market momentum by filtering out "noise" and identifying underlying trends. Unlike standard momentum oscillators that can be erratic, this tool uses an adaptive logic to adjust to changing market conditions in real-time.
How the Logic Works
1. Adaptive Period Detection The core strength of this script is its ability to "self-adjust." Instead of using a fixed number of bars to calculate momentum (which might work well in a trending market but fail in a choppy one), it utilizes a secondary calculation to determine a dynamic period. It constantly analyzes the current price action to decide how much historical data it should consider at any given moment.
2. Price Point Calculation To ensure the data is as clean as possible, the script focuses on the "mid-point" of each price candle (the average of the high and low prices). By using these mid-points rather than just the closing price, the indicator creates a more stable foundation for calculating momentum, reducing the influence of sudden, temporary spikes.
3. The Smoothing Mechanism Once the momentum is calculated based on the adaptive period, the script applies a specialized mathematical smoothing process. It doesn't just average the previous results; it uses a specific coefficient system (based on trigonometry and exponential decay). This allows the indicator to:
- Retain the "memory" of recent price movements.
- Smooth out jagged fluctuations that often trigger false signals.
- Provide a fluid, readable line that highlights the true direction of the market force.
What this means for the user
When you observe the resulting line on your chart:
- Trend Identification: The script helps distinguish between a strong, sustained move and a temporary fluctuation.
- Reduced Lag: Because the period is adaptive, the indicator attempts to react quickly to new trends while remaining smooth enough to prevent "whipsaws" (frequent, incorrect signals).
- Visual Clarity: By filtering out the "jitter" of the market, it provides a clearer visual representation of whether the underlying momentum is accelerating or decelerating.
//+------------------------------------------------------------------+
//|                                     SmoothedAdaptiveMomentum.mq4 |
//|                                                                  |
//| Smoothed Adaptive Momentum                                       |
//|                                                                  |
//| Algorithm taken from book                                        |
//|     "Cybernetics Analysis for Stock and Futures"                 |
//| by John F. Ehlers                                                |
//|                                                                  |
//|                                              contact@mqlsoft.com |
//|                                          http://www.mqlsoft.com/ |
//+------------------------------------------------------------------+
#property copyright "Coded by Witold Wozniak"
#property link      "www.mqlsoft.com"

#property indicator_separate_window
#property indicator_buffers 2
#property indicator_color1 Red
#property indicator_color2 Blue

#property indicator_level1 0

double Momentum[];

extern double Alpha = 0.07;
extern int Cutoff = 8;
int buffers = 0;
int drawBegin = 0;

double tempReal, rad2Deg, deg2Rad;

int init() {
    drawBegin = 60;
    initBuffer(Momentum, "Momentum", DRAW_LINE);
    IndicatorBuffers(buffers);
    IndicatorShortName("Smoothed Adaptive Momentum [" + DoubleToStr(Alpha, 2) + ", " + Cutoff + "]");
    tempReal = MathArctan(1.0);
    rad2Deg = 45.0 / tempReal;
    deg2Rad = 1.0 / rad2Deg;
    return (0);
}

int start() {
    if (Bars <= drawBegin) return (0);
    int countedBars = IndicatorCounted();
    if (countedBars < 0) return (-1);
    if (countedBars > 0) countedBars--;
    int s, limit = Bars - countedBars - 1;
    for (s = limit; s >= 0; s--) {
        double period = iCustom(0, 0, "CyclePeriod", Alpha, 0, s);
        int intPeriod = MathFloor(period);
        double Value1 = P(s) - P(s + intPeriod - 1);
        double a1 = MathExp(-3.1415926535 / Cutoff);
        double b1 = 2 * a1 * MathSin(deg2Rad * 1.738 * 180 / Cutoff);
        double c1 = a1 * a1;
        double coef2 = b1 + c1;
        double coef3 = -(c1 + b1 * c1);
        double coef4 = c1 * c1;
        double coef1 = 1.0 - coef2 - coef3 - coef4;
        Momentum[s] = coef1 * Value1 + coef2 * Momentum[s + 1] +
            coef3 * Momentum[s + 2] + coef4 * Momentum[s + 3];
        if (s > Bars - 8) {
            Momentum[s] = Value1;
        }
    }
    return (0);
}

double P(int index) {
    return ((High[index] + Low[index]) / 2.0);
}

void initBuffer(double array[], string label = "", int type = DRAW_NONE, int arrow = 0, int style = EMPTY, int width = EMPTY, color clr = CLR_NONE) {
    SetIndexBuffer(buffers, array);
    SetIndexLabel(buffers, label);
    SetIndexEmptyValue(buffers, EMPTY_VALUE);
    SetIndexDrawBegin(buffers, drawBegin);
    SetIndexShift(buffers, 0);
    SetIndexStyle(buffers, type, style, width);
    SetIndexArrow(buffers, arrow);
    buffers++;
}
Comments