Solar Wind
Download script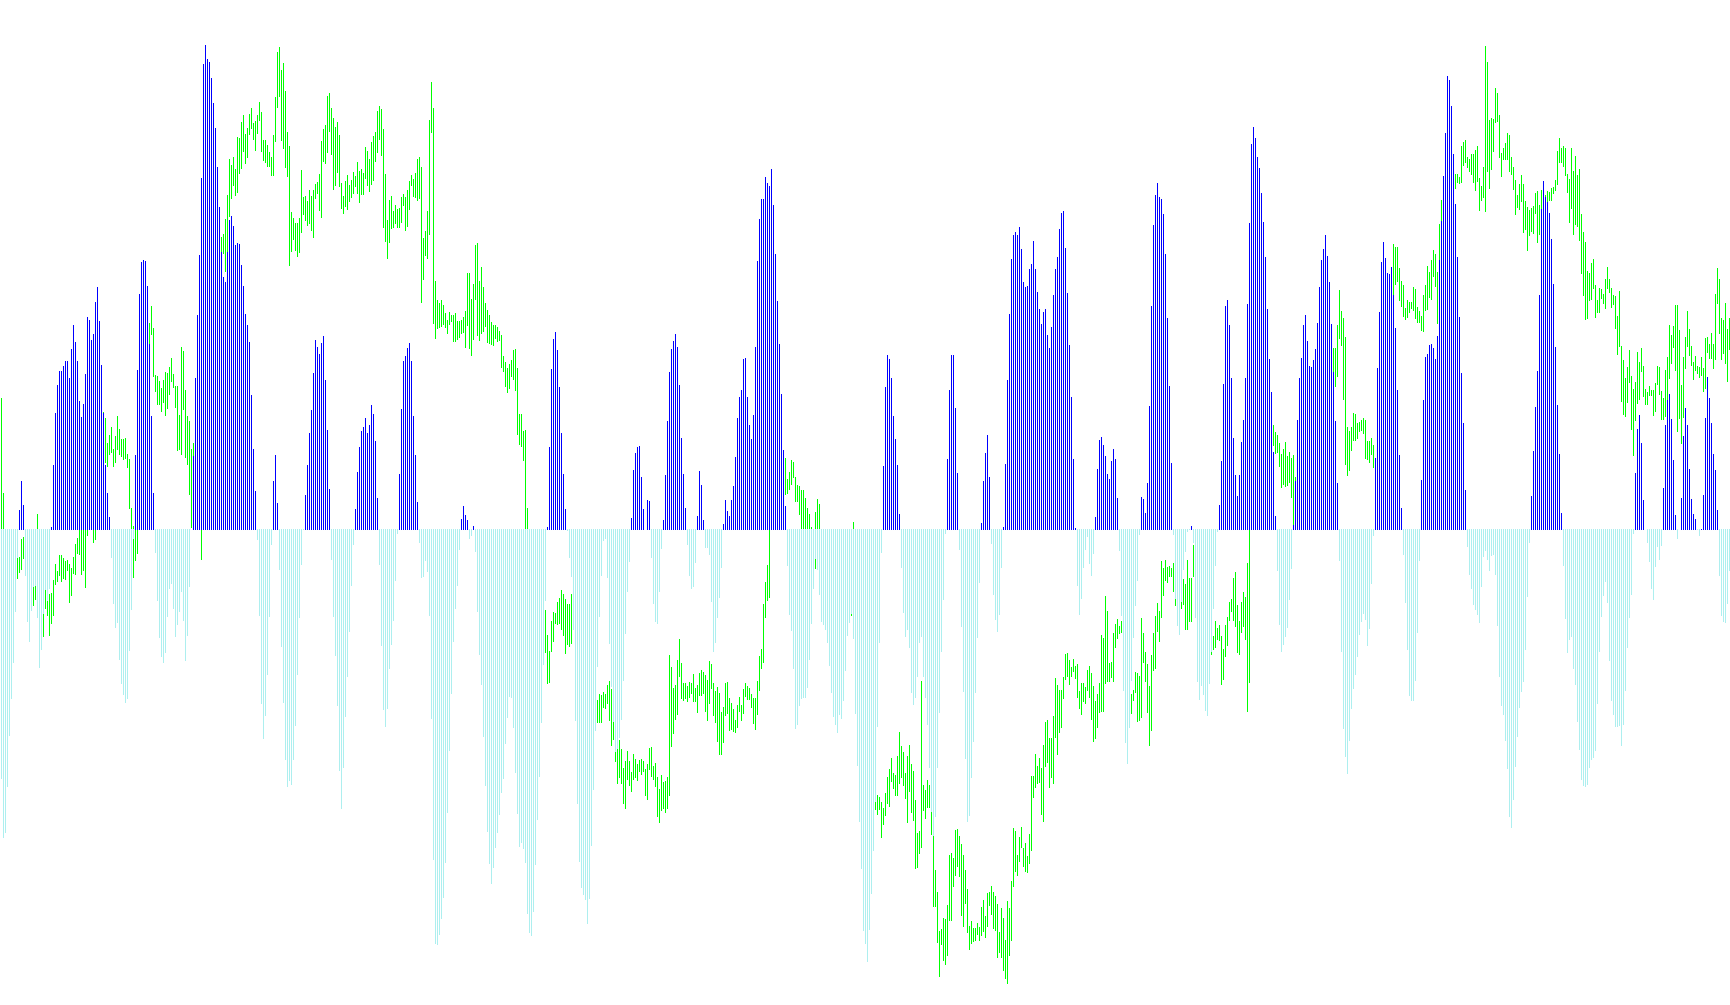
This indicator, titled "Solar Wind," is designed to analyze market price action by transforming raw price movements into a visual momentum stream. It focuses on identifying the direction of price flow and isolating specific trends to help traders distinguish between bullish and bearish phases.
Core Logic Overview
The script operates in two distinct stages:
1. Momentum Calculation First, the indicator looks at a specific window of recent price history (defined by the user-adjustable period). It identifies the highest high and the lowest low within that window to establish a dynamic range.
It then calculates a "Relative Value" based on where the current price sits between those highs and lows. This value is smoothed using a weighted moving average technique, ensuring that the resulting data is fluid rather than jagged. By applying a logarithmic transformation to this smoothed data, the indicator converts the price fluctuations into a normalized momentum value that fluctuates around a zero line.
2. Trend Identification and Filtering Once the momentum values are generated, the script performs a secondary analysis to determine the "polarity" of the market:
- Bullish Movement: When the momentum values stay above zero, the indicator identifies this as an upward trend.
- Bearish Movement: When the momentum values drop below zero, it identifies a downward trend.
3. Visual Representation The final output is presented in a separate window on your chart using two distinct histograms:
- One color (Lime) highlights the momentum during periods of positive growth.
- The other color (Red) highlights the momentum during periods of negative decline.
By effectively "switching" which color is visible based on whether the calculated value is positive or negative, the tool provides a clear visual map of market direction, allowing you to see at a glance whether the current price flow is leaning toward an upward or downward bias.
#property  copyright "Copyright © 2005, Yura Prokofiev"
#property  link      "Yura.prokofiev@gmail.com"

#property  indicator_separate_window
#property  indicator_buffers 3
#property  indicator_color1  Black
#property  indicator_color2  Lime
#property  indicator_color3  Red

extern int period=10;

double         ExtBuffer0[];
double         ExtBuffer1[];
double         ExtBuffer2[];


int init()
  {


   SetIndexStyle(0,DRAW_NONE);
   SetIndexStyle(1,DRAW_HISTOGRAM);
   SetIndexStyle(2,DRAW_HISTOGRAM);
   IndicatorDigits(Digits+1);

   SetIndexBuffer(0,ExtBuffer0);
   SetIndexBuffer(1,ExtBuffer1);
   SetIndexBuffer(2,ExtBuffer2);

   IndicatorShortName("SOLAR WIND");
   SetIndexLabel(1,NULL);
   SetIndexLabel(2,NULL);

   return(0);
  }


int start()
  {
   //int     period=10;
   int    limit;
   int    counted_bars=IndicatorCounted();
   double prev,current,old;
   double Value=0,Value1=0,Value2=0,Fish=0,Fish1=0,Fish2=0;
   double price;
   double MinL=0;
   double MaxH=0;


   if(counted_bars>0) counted_bars--;
   limit=Bars-counted_bars;


   for(int i=0; i<limit; i++)
    {  MaxH = High[Highest(NULL,0,MODE_HIGH,period,i)];
       MinL = Low[Lowest(NULL,0,MODE_LOW,period,i)];
      price = (High[i]+Low[i])/2;
      Value = 0.33*2*((price-MinL)/(MaxH-MinL)-0.5) + 0.67*Value1;
      Value=MathMin(MathMax(Value,-0.999),0.999);
      ExtBuffer0[i]=0.5*MathLog((1+Value)/(1-Value))+0.5*Fish1;
      Value1=Value;
      Fish1=ExtBuffer0[i];

    }


   bool up=true;
   for(i=limit-2; i>=0; i--)
     {
      current=ExtBuffer0[i];
      prev=ExtBuffer0[i+1];

      if (((current<0)&&(prev>0))||(current<0))   up= false;
      if (((current>0)&&(prev<0))||(current>0))   up= true;

      if(!up)
        {
         ExtBuffer2[i]=current;
         ExtBuffer1[i]=0.0;
        }

       else
         {
          ExtBuffer1[i]=current;
          ExtBuffer2[i]=0.0;
         }
     }

   return(0);
  }
Comments