SmCCI_test
Download script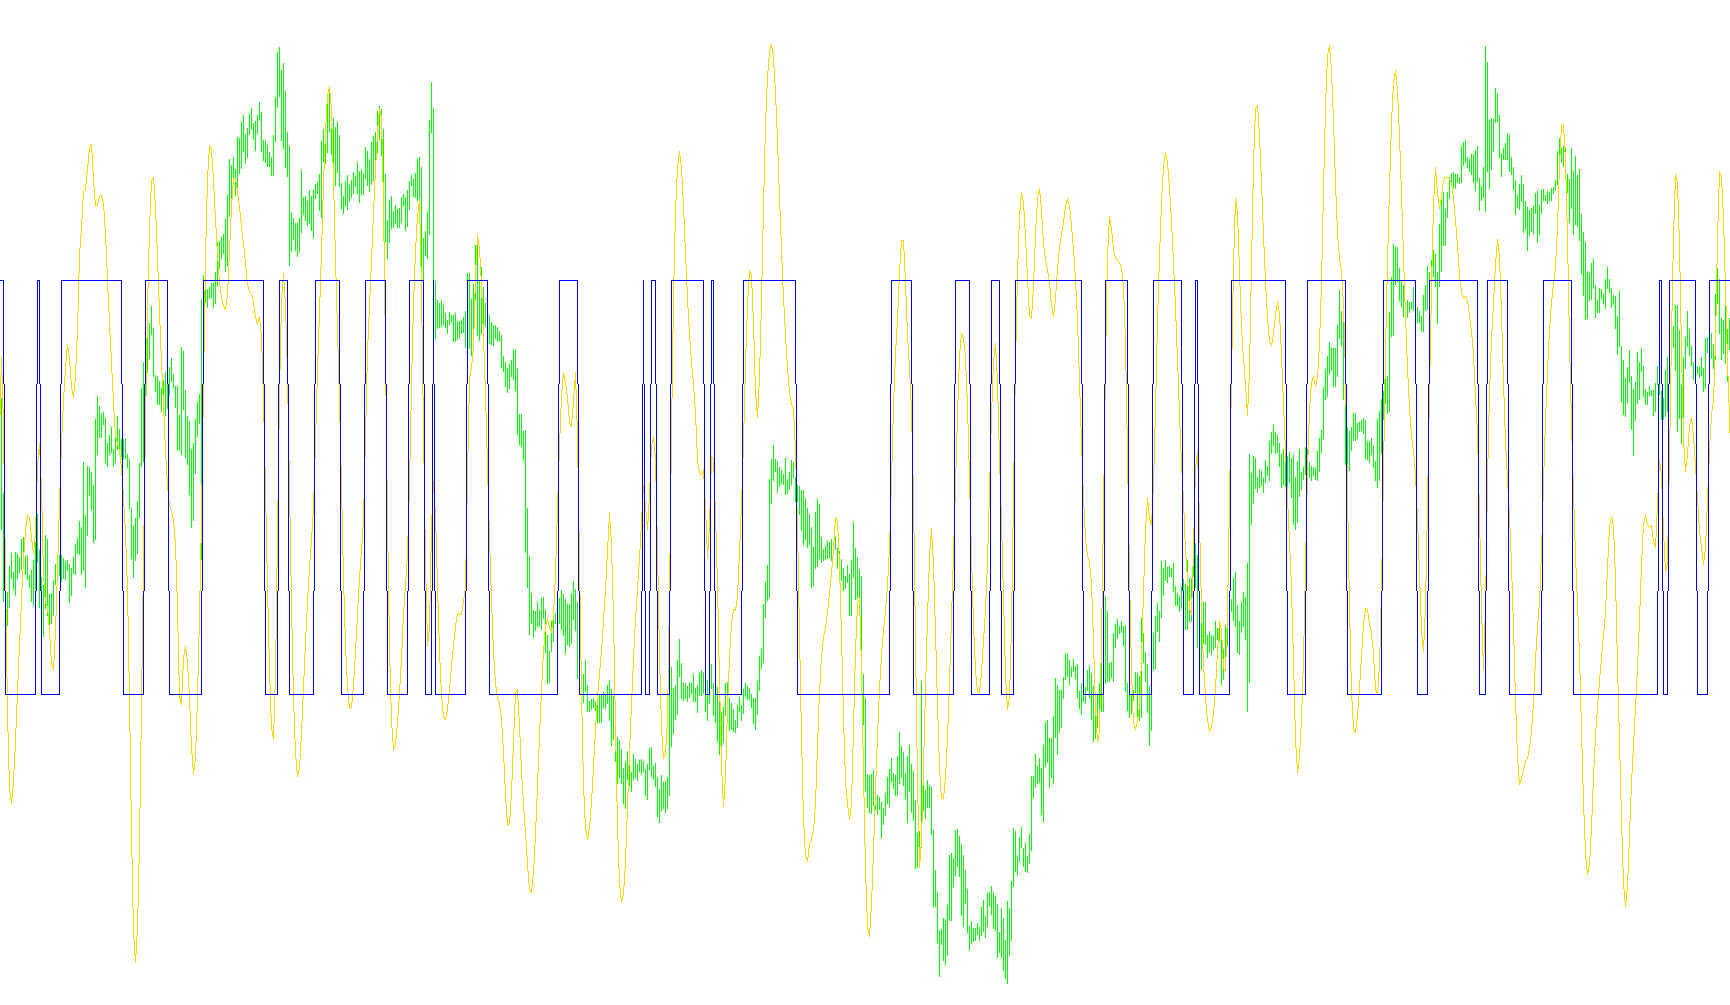
Technical Overview: SmCCI Indicator Logic
This script is a custom technical analysis tool designed to visualize market momentum and price trends on a secondary window of your trading platform. Instead of showing raw price action, it processes data to identify underlying shifts in market velocity, helping traders distinguish between sustained trends and temporary fluctuations.
Core Mechanics
The logic operates by combining two distinct types of financial indicators: the Commodity Channel Index (CCI) and a specialized Smoothing Filter.
- Momentum Foundation: The script begins by calculating the Commodity Channel Index (CCI). This is a standard market tool used to determine if an asset is overbought, oversold, or trending strongly relative to its recent average price.
- Multi-Stage Smoothing: Once the CCI value is obtained, the script does not plot it immediately. Instead, it passes the data through a multi-layered mathematical "chain." It applies a series of weighted averages (smoothing cycles) to the data. This process filters out "noise"—the jagged, erratic price movements that can often lead to false signals—leaving behind a cleaner, more readable trend line.
- Polynomial Calculation: The script uses a specific set of coefficients to weight these smoothed values. By calculating these specific relationships, the tool attempts to create a more refined representation of market movement than a standard moving average could provide.
Visual Representation and Signals
The indicator provides two distinct visual lines on your chart:
- The Trend Line (Gold): This represents the final processed value after all smoothing and polynomial calculations are complete. It shows the "heartbeat" of the momentum. When this line moves upward, it suggests strengthening bullish momentum; downward movement suggests bearish momentum.
- The Trigger Level (Blue): The logic includes a binary "trigger" system. Based on whether the final calculated trend value is positive or negative, the script switches the blue line to specific extreme thresholds (defined by your settings, typically representing the upper and lower boundaries of the indicator window).
Summary for the Trader
In practical terms, this tool acts as a sophisticated "filter." It takes the raw momentum of the market, strips away the minor volatility, and smooths it into a flowing trend line. The gold line helps you see the direction of the current move, while the blue line provides a constant visual reference for the boundaries of that movement. By observing where the gold trend line interacts with the blue trigger levels, traders can better identify significant shifts in market sentiment.
//+------------------------------------------------------------------+
//|                                                        SmCCI.mq4 |
//|                      Copyright © 2006, MetaQuotes Software Corp. |
//|                                        http://www.metaquotes.net |
//+------------------------------------------------------------------+
#property copyright "Copyright © 2006, MetaQuotes Software Corp."
#property link      "http://www.metaquotes.net"

#property indicator_separate_window
#property indicator_buffers 2
#property indicator_color1 Gold
#property indicator_color2 Blue
//---- input parameters
extern int       x_prd=0;
extern int       t3_period=8;
extern double    b=0.7;
extern int       per=14;
extern int       ppor=100;
extern int       mpor=-100;
//---- buffers
double ExtMapBuffer1[];
double ExtMapBuffer2[];
double e1, e2, e3, e4, e5, e6, c1, c2, c3, c4, n, w1, w2, b2, b3;
double dpo, t3, shift, cci, trig;
//+------------------------------------------------------------------+
//| Custom indicator initialization function                         |
//+------------------------------------------------------------------+
int init()
  {
//---- indicators
   SetIndexStyle(0,DRAW_LINE);
   SetIndexBuffer(0,ExtMapBuffer1);
   SetIndexStyle(1,DRAW_LINE);
   SetIndexBuffer(1,ExtMapBuffer2);
//----
   return(0);
  }
//+------------------------------------------------------------------+
//| Custom indicator iteration function                              |
//+------------------------------------------------------------------+
int start()
  {
   b2=b*b;
   b3=b2*b;
   c1=-b3;
   c2=(3*(b2+b3));
   c3=-3*(2*b2+b+b3);
   c4=(1+3*b+b3+3*b2);
   n=t3_period;

   if (n<1) n=1;
   n = 1 + 0.5*(n-1);
   w1 = 2 / (n + 1);
   w2 = 1 - w1;

   for(int i=Bars-1; i>=0; i--)
   {
      cci=iCCI(NULL,0,per,PRICE_TYPICAL,i);
      dpo=cci;
      e1 = w1*dpo + w2*e1;
      e2 = w1*e1 + w2*e2;
      e3 = w1*e2 + w2*e3;
      e4 = w1*e3 + w2*e4;
      e5 = w1*e4 + w2*e5;
      e6 = w1*e5 + w2*e6;

      t3 = c1*e6 + c2*e5 + c3*e4 + c4*e3;

      if (t3==0) t3=0.0001;
      if (t3>0) trig=ppor;
      if (t3<0) trig=mpor;

      ExtMapBuffer1[i]=t3;
      ExtMapBuffer2[i]=trig;
   }

   return(0);
  }
//+------------------------------------------------------------------+
Comments