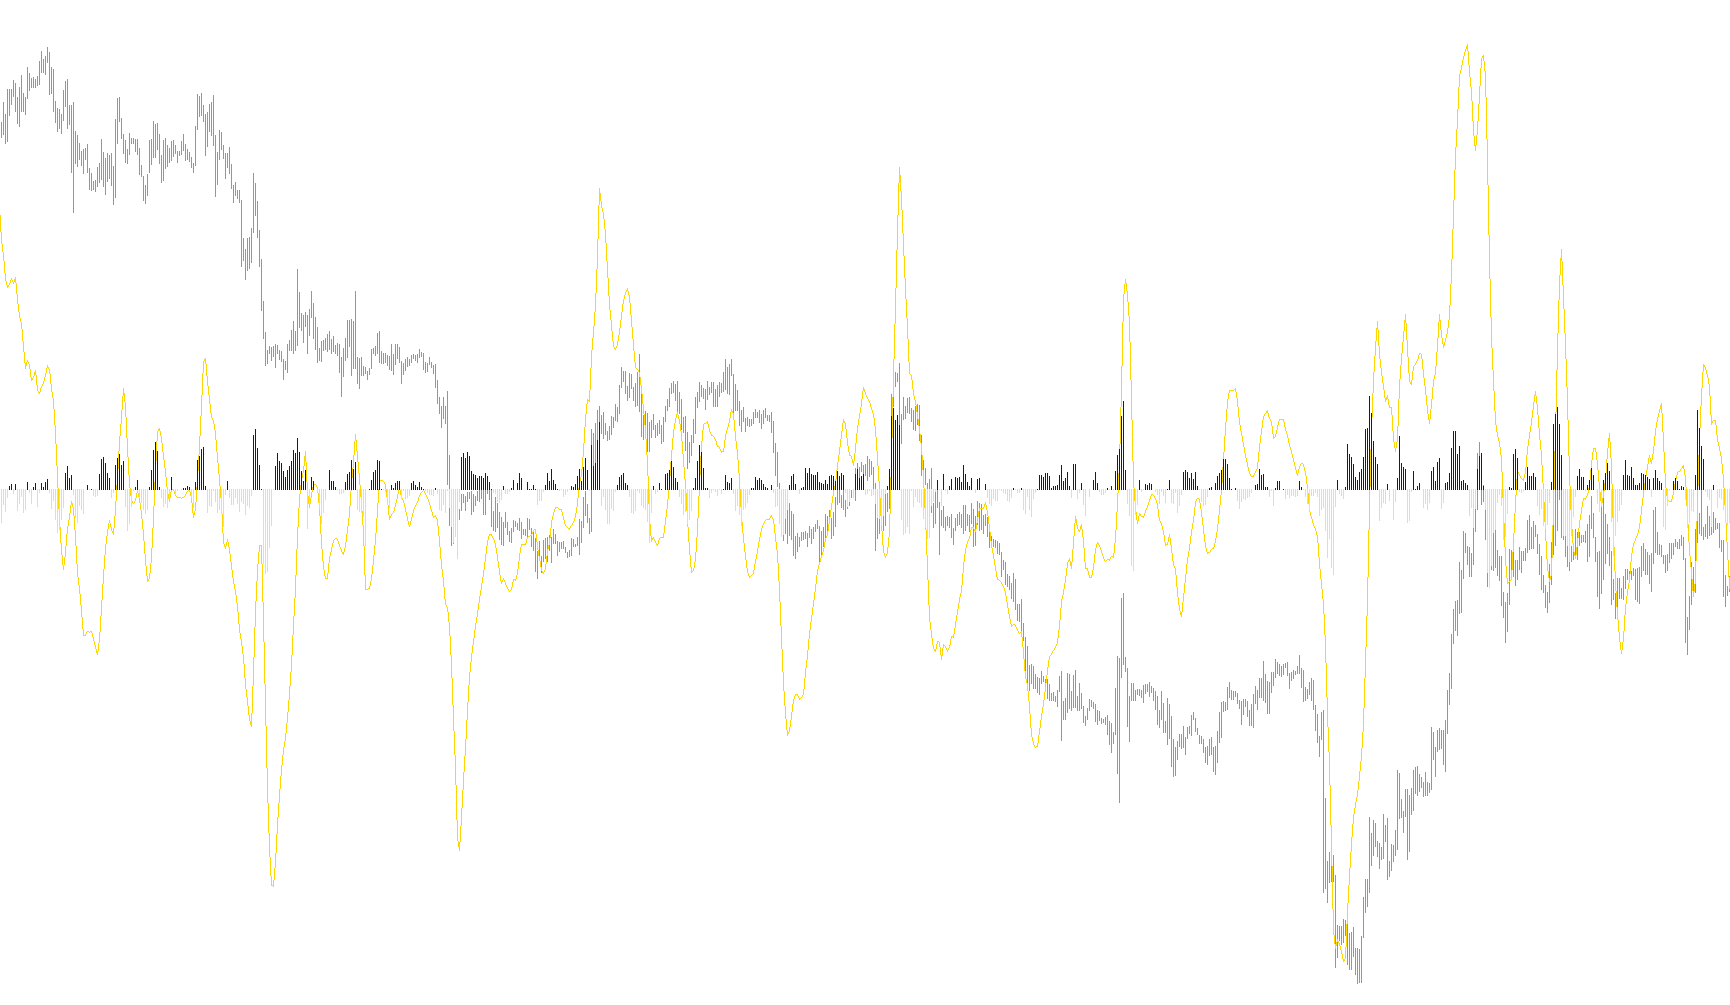
This tool is designed to help traders identify the prevailing market direction on a weekly basis by analyzing price momentum. Rather than simply looking at where the price is currently sitting, the script focuses on how the relationship between two different moving averages is changing over time.
How the Logic Works
The core of this indicator relies on comparing two mathematical averages:
- A Fast Average (SMA 5): This reacts quickly to recent price movements.
- A Slow Average (EMA 21): This provides a smoother, longer-term view of the trend.
By calculating the difference between these two averages, the tool creates a "momentum gap." The script then monitors how this gap grows or shrinks from one week to the next.
Determining Market Direction
The indicator classifies the market direction based on whether that "gap" is expanding or contracting:
- Upward Trend: If the difference between the two averages is increasing compared to the previous period, the tool identifies an "UP" direction. This suggests that the short-term momentum is gaining strength relative to the long-term trend.
- Downward Trend: If the difference between the two averages is decreasing compared to the previous period, the tool identifies a "DOWN" direction. This suggests that short-term momentum is weakening or pulling away negatively from the long-term trend.
Visual and Data Outputs
To make this information easy to read, the script provides three distinct visual layers:
- A Continuous Line: Tracks the raw difference between the two averages so you can see the "distance" of the trend.
- Two Separate Histograms: These act as directional signals. One color highlights upward momentum shifts, while another color highlights downward momentum shifts.
Automation and Tracking
Beyond the visual charts, the script performs background tasks to keep your trading data organized:
- Real-time Comments: It automatically displays a text summary on your screen, showing the current symbol, the specific week being analyzed, and the calculated direction (UP/DOWN) along with its numerical strength.
- Data Storage: It saves these weekly direction values into the platform's global memory. This ensures that the trend data for a specific week is recorded and accessible even if you switch between different charts or timeframes.
//+------------------------------------------------------------------+
//| 4Hour Vegas Model - Weekly Chart Direction Calculator            |
//|                                                           Spiggy |
//|                                                                  |
//+------------------------------------------------------------------+
#property copyright "Spiggy"
#property link      ""

#property indicator_separate_window
#property indicator_buffers 4
#property indicator_color1 Blue
#property indicator_color2 Green
#property indicator_color3 Red

//---- input parameters

//---- buffers
double ExtMapBuffer1[];
double ExtMapBuffer2[];
double ExtMapBuffer3[];

//+------------------------------------------------------------------+
//| Custom indicator initialization function                         |
//+------------------------------------------------------------------+
int init()
  {
//---- indicators
   SetIndexStyle(0,DRAW_LINE);
   SetIndexBuffer(0,ExtMapBuffer1);
   SetIndexStyle(1,DRAW_HISTOGRAM);
   SetIndexBuffer(1,ExtMapBuffer2);
   SetIndexStyle(2,DRAW_HISTOGRAM);
   SetIndexBuffer(2,ExtMapBuffer3);

//----
   return(0);
  }
//+------------------------------------------------------------------+
//| Custor indicator deinitialization function                       |
//+------------------------------------------------------------------+
int deinit()
  {
//----

//----
   return(0);
  }
//+------------------------------------------------------------------+
//| Custom indicator iteration function                              |
//+------------------------------------------------------------------+
int start()
{
  int    limit;
  double EMA21;
  double SMA5;
  double EMA21Prev;
  double SMA5Prev;
  string ValueIndex;
  string Direction;

  // Always prepare all of the information for the other indicators
  limit=Bars;

  //---- main loop
  for(int i=limit; i>=0; i--)
  {
    //---- Calculate the current weekly trend
    EMA21=iMA(NULL,0,21,0,MODE_EMA,(PRICE_HIGH+PRICE_LOW)/2,i);
    SMA5 =iMA(NULL,0,5,0,MODE_SMA,(PRICE_HIGH+PRICE_LOW)/2,i);

    //---- Calculate the previous weekly trend
    EMA21Prev=iMA(NULL,0,21,0,MODE_EMA,(PRICE_HIGH+PRICE_LOW)/2,i+1);
    SMA5Prev =iMA(NULL,0,5,0,MODE_SMA,(PRICE_HIGH+PRICE_LOW)/2,i+1);

    // Calculate the difference of the MAs
    ExtMapBuffer1[i] = SMA5-EMA21;

    // Calculate the difference of the MAs
    if (((SMA5-EMA21) - (SMA5Prev-EMA21Prev)) > 0.0 )
    {
      ExtMapBuffer2[i] = (SMA5-EMA21) - (SMA5Prev-EMA21Prev);
      ExtMapBuffer3[i] = 0.0;
      Direction = "UP";
    }

    if (((SMA5-EMA21) - (SMA5Prev-EMA21Prev)) < 0.0 )
    {
      ExtMapBuffer2[i] = 0.0;
      ExtMapBuffer3[i] = (SMA5-EMA21) - (SMA5Prev-EMA21Prev);
      Direction = "DOWN";
    }

    // Calculate the start of the week and publish the value in a global variable
    // Publish this with the previous Sunday as the index
    ValueIndex = TimeToStr(Time[i]-TimeDayOfWeek(Time[i]),TIME_DATE);
    Comment(Symbol() + "-ThisWeekDirection-" + ValueIndex + "\n" + Direction + ":(" + ((SMA5-EMA21) - (SMA5Prev-EMA21Prev)) + ")");
    GlobalVariableSet(Symbol() + "-ThisWeekDirection-" + ValueIndex, ((SMA5-EMA21) - (SMA5Prev-EMA21Prev)));

  }

   return(0);
  }
//+------------------------------------------------------------------+
Comments