4hVegasMetaTraderWeeklyChart_v1
Download script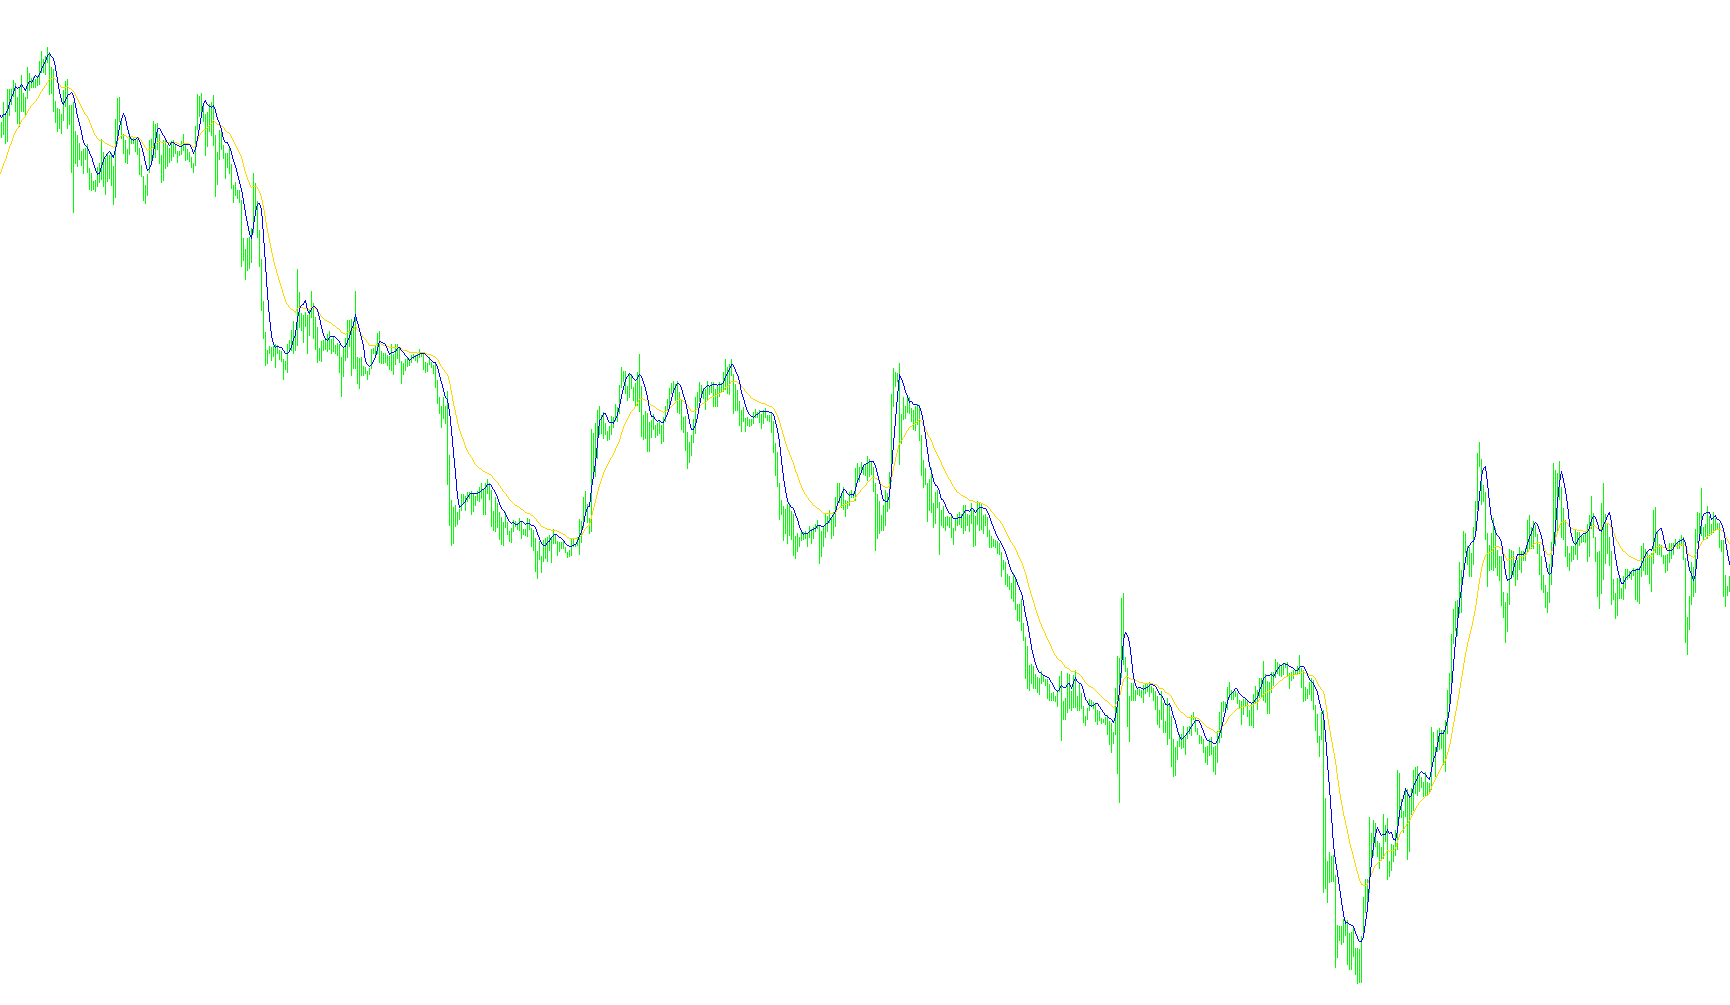
This tool is designed to provide visual guidance on your trading charts by identifying key trend levels based on price movement. It automatically calculates and plots two distinct moving average lines, which serve as dynamic markers to help traders gauge the current momentum of the market.
How it Works
The script analyzes historical price data to determine "average" prices over specific periods. Instead of looking at just the closing price, it calculates these averages based on the midpoint between each candle's highest and lowest points (the median price). This provides a more balanced view of the price action during each time interval.
The Core Components
The indicator displays two unique lines on your chart to help differentiate between short-term and medium-term trends:
- The Medium-Term Trend (Green Line): This line calculates an Exponential Moving Average based on a 21-period window. By using an "exponential" calculation, the script gives more importance to recent price action, allowing the line to react more quickly to new information while still smoothing out minor fluctuations.
- The Short-Term Trend (Blue Line): This line calculates a Simple Moving Average based on a 5-period window. It provides a faster snapshot of the immediate price direction, helping to identify quick shifts in sentiment.
Purpose for the Trader
By overlaying these two lines on your chart, the tool allows you to visualize the relationship between short-term volatility and broader market trends. Traders can use these markers to observe where price is currently positioned relative to historical averages, potentially identifying areas of support, resistance, or momentum shifts without having to perform complex manual calculations.
/*-----------------------------+
|			       |
| Shared by www.Aptrafx.com    |
|			       |
+------------------------------*/

//+------------------------------------------------------------------+
//| 4Hour Vegas Model - Weekly Chart MA lines                        |
//|                                                           Spiggy |
//|                                                                  |
//+------------------------------------------------------------------+
#property copyright "Spiggy"
#property link      ""

#property indicator_chart_window
#property indicator_buffers 2
#property indicator_color1 Green
#property indicator_color2 Blue


//---- input parameters

//---- buffers
double ExtMapBuffer1[];
double ExtMapBuffer2[];

//+------------------------------------------------------------------+
//| Custom indicator initialization function                         |
//+------------------------------------------------------------------+
int init()
  {
//---- indicators
   SetIndexStyle(0,DRAW_LINE);
   SetIndexBuffer(0,ExtMapBuffer1);
   SetIndexStyle(1,DRAW_LINE);
   SetIndexBuffer(1,ExtMapBuffer2);

//----
   return(0);
  }
//+------------------------------------------------------------------+
//| Custor indicator deinitialization function                       |
//+------------------------------------------------------------------+
int deinit()
  {
//----

//----
   return(0);
  }
//+------------------------------------------------------------------+
//| Custom indicator iteration function                              |
//+------------------------------------------------------------------+
int start()
{
  int    limit;
  int    counted_bars=IndicatorCounted();
  double EMA21;
  double SMA5;

  //---- check for possible errors
  if(counted_bars<0) return(-1);
  //---- last counted bar will be recounted
  if(counted_bars>0) counted_bars--;
  limit=Bars-counted_bars;
  //---- main loop
  for(int i=0; i<limit; i++)
  {
    //---- ma_shift set to 0 because SetIndexShift called abowe
    EMA21=iMA(NULL,0,21,0,MODE_EMA,(PRICE_HIGH+PRICE_LOW)/2,i);
    SMA5 =iMA(NULL,0,5,0,MODE_SMA,(PRICE_HIGH+PRICE_LOW)/2,i);

    ExtMapBuffer1[i] = EMA21;
    ExtMapBuffer2[i] = SMA5;
  }

  return(0);
}
//+------------------------------------------------------------------+
Comments