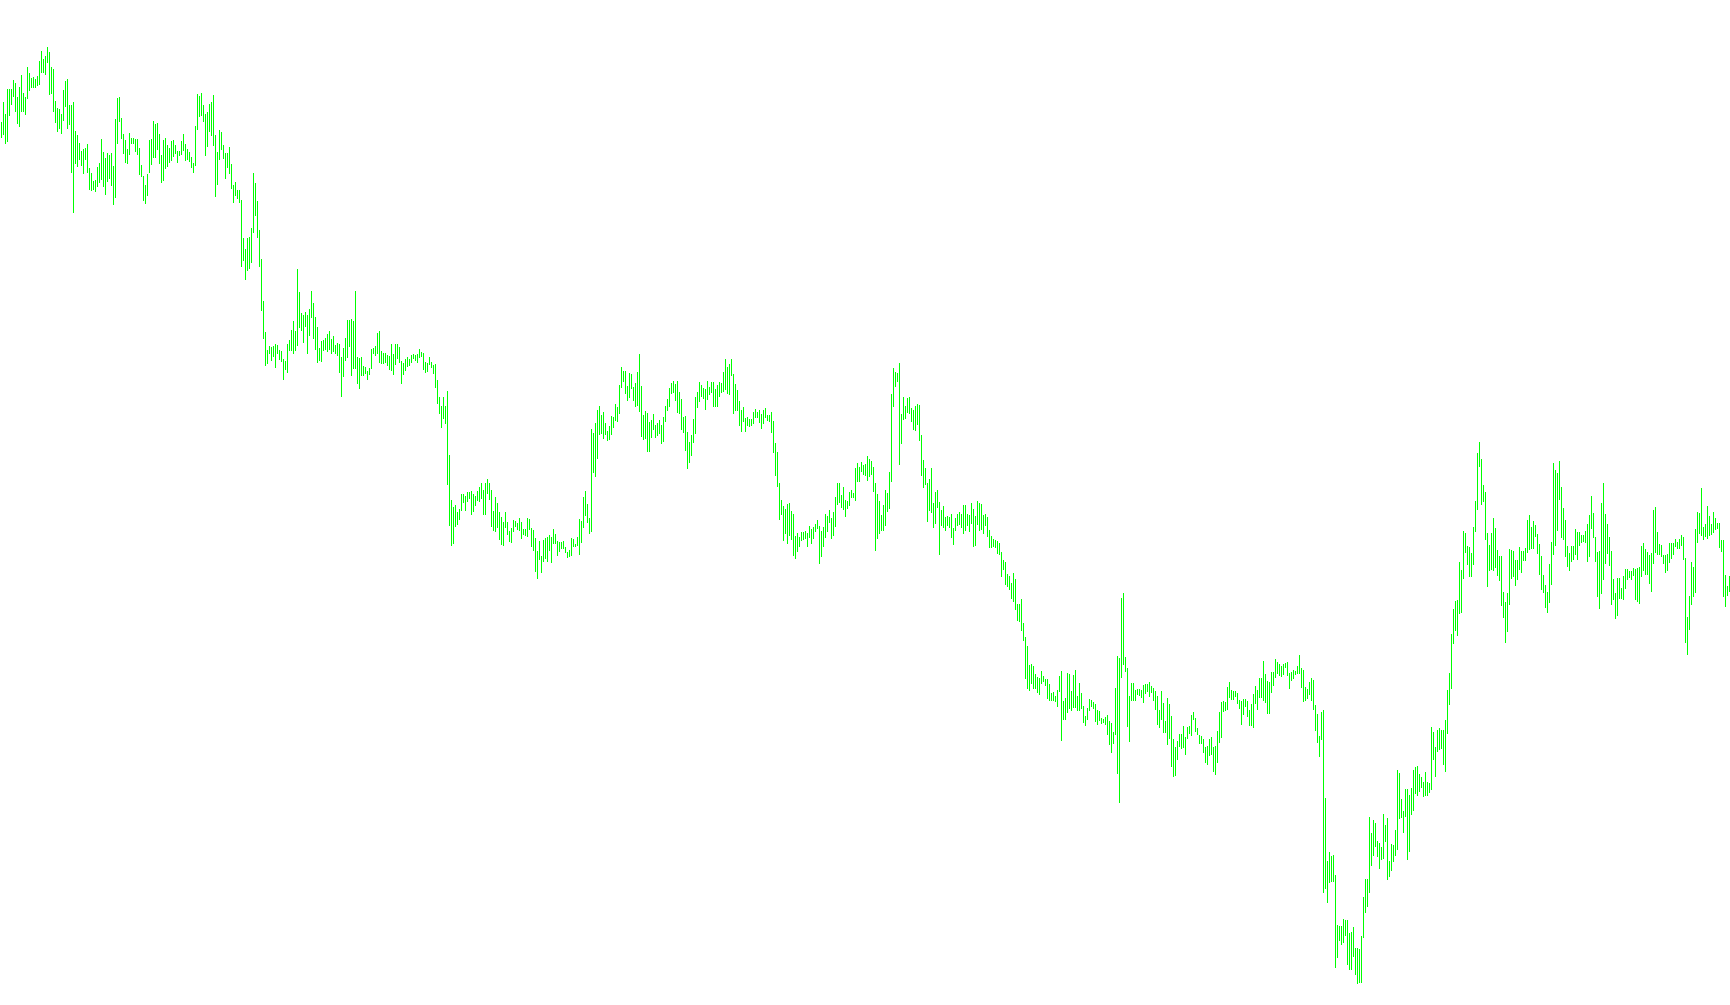
This tool is designed to provide traders with a clear, visual representation of market trends by analyzing the relationship between four different Moving Averages (MAs). Instead of cluttering your main chart with multiple intersecting lines, this script generates a simplified visual signal in a separate window at the bottom of your trading platform.
How the Logic Works
The script functions by monitoring four specific mathematical averages simultaneously. Each average is configured with its own unique "length" (the amount of historical data it considers) and "mode" (how it calculates that data). By comparing these four values against each other, the tool identifies the momentum of the market:
- Bullish Trend Identification: When the shortest moving average is higher than the second, the second is higher than the third, and the third is higher than the fourth, the script recognizes a strong upward trend. This triggers a visual signal in Lime Green.
- Bearish Trend Identification: Conversely, if the shortest moving average is lower than the second, the second is lower than the third, and the third is lower than the fourth, it recognizes a strong downward trend. This triggers a visual signal in Red.
- Neutral/Sideways Market: If neither of the above conditions is met—meaning the averages are tangled or not moving in a consistent direction—the script indicates a "flat" or neutral trend using a Gold signal.
Key Customization Features
The logic allows for high levels of flexibility to suit different trading styles:
- Timeframe Selection: You can choose which specific timeframe the indicator should calculate on (e.g., 1-minute, 1-hour, Daily, Weekly, or Monthly). This allows you to see long-term trends while trading on shorter timeframes.
- Adjustable Parameters: The values for each of the four moving averages are fully customizable. You can change their lengths and calculation methods to match your personal strategy or to filter out market "noise" more effectively.
Summary for Traders
Essentially, this script acts as a filter. It strips away the complexity of price action and tells you three things clearly: Is the trend going up? Is it going down? Or is it currently flat? By using a separate window with distinct colors, it helps you stay disciplined by identifying the prevailing market direction at a glance.
//+------------------------------------------------------------------+
//|                                                    4MAs Trend.mq4|
//|                                                                  |
//|                                        http://www.metaquotes.net |
//+------------------------------------------------------------------+
#property indicator_separate_window
#property indicator_minimum 0
#property indicator_maximum 1
#property indicator_buffers 3
#property indicator_color1 Red
#property indicator_color2 LimeGreen
#property indicator_color3 Gold
//---- input parameters
extern int Minutes=60;
extern int MA1_Value=5;
extern int MA1_Mode=0;
extern int MA2_Value=13;
extern int MA2_Mode=0;
extern int MA3_Value=34;
extern int MA3_Mode=3;
extern int MA4_Value=55;
extern int MA4_Mode=3;
//---- buffers
double ExtMapBuffer1[];
double ExtMapBuffer2[];
double ExtMapBuffer3[];
string TimeFrameStr;
double MA1,MA2,MA3,MA4;
//+------------------------------------------------------------------+
//| Custom indicator initialization function                         |
//+------------------------------------------------------------------+
int init()
  {
//---- indicators
   SetIndexStyle(0,DRAW_HISTOGRAM,STYLE_SOLID,2,Red);
   SetIndexBuffer(0,ExtMapBuffer1);
   SetIndexStyle(1,DRAW_HISTOGRAM,STYLE_SOLID,2, LimeGreen);
   SetIndexBuffer(1,ExtMapBuffer2);
   SetIndexStyle(2,DRAW_HISTOGRAM,STYLE_SOLID,2, Gold);
   SetIndexBuffer(2,ExtMapBuffer3);
//----
   switch(Minutes)
     {
      case 1 : TimeFrameStr="Period_M1"; break;
      case 5 : TimeFrameStr="Period_M5"; break;
      case 15 : TimeFrameStr="Period_M15"; break;
      case 30 : TimeFrameStr="Period_M30"; break;
      case 60 : TimeFrameStr="Period_H1"; break;
      case 240 : TimeFrameStr="Period_H4"; break;
      case 1440 : TimeFrameStr="Period_D1"; break;
      case 10080 : TimeFrameStr="Period_W1"; break;
      case 43200 : TimeFrameStr="Period_MN1"; break;
      default : TimeFrameStr="Current Timeframe"; Minutes=0;
     }
   IndicatorShortName("Flat Trend w 4 MAs ("+TimeFrameStr+")");
//----
   return(0);
  }
//+------------------------------------------------------------------+
//| Custom indicator deinitialization function                       |
//+------------------------------------------------------------------+
int deinit()
  {
//----
//----
   return(0);
  }
//+------------------------------------------------------------------+
//| Custom indicator iteration function                              |
//+------------------------------------------------------------------+
int start()
  {
   int    counted_bars=IndicatorCounted();
//----
     for(int i=0; i < 300; i++){
      ExtMapBuffer1[i]=0;
      ExtMapBuffer2[i]=0;
      ExtMapBuffer3[i]=0;
//----
      MA1=iMA(NULL,Minutes,MA1_Value,0,MA1_Mode,PRICE_CLOSE,i);
      MA2=iMA(NULL,Minutes,MA2_Value,0,MA2_Mode,PRICE_CLOSE,i);
      MA3=iMA(NULL,Minutes,MA3_Value,0,MA3_Mode,PRICE_CLOSE,i);
      MA4=iMA(NULL,Minutes,MA4_Value,0,MA4_Mode,PRICE_CLOSE,i);
//----
      if(MA1 > MA2 && MA2 > MA3 && MA3 > MA4 )ExtMapBuffer2[i]=1;
      if(MA1 < MA2 && MA2 < MA3 && MA3 < MA4 )ExtMapBuffer1[i]=1;
      if(ExtMapBuffer1[i]==0 && ExtMapBuffer2[i]==0)  {ExtMapBuffer3[i]=1;}
     }
//----
   return(0);
  }
//+------------------------------------------------------------------+
Comments