4hVegasMetaTraderWeeklyChart(2)
Download script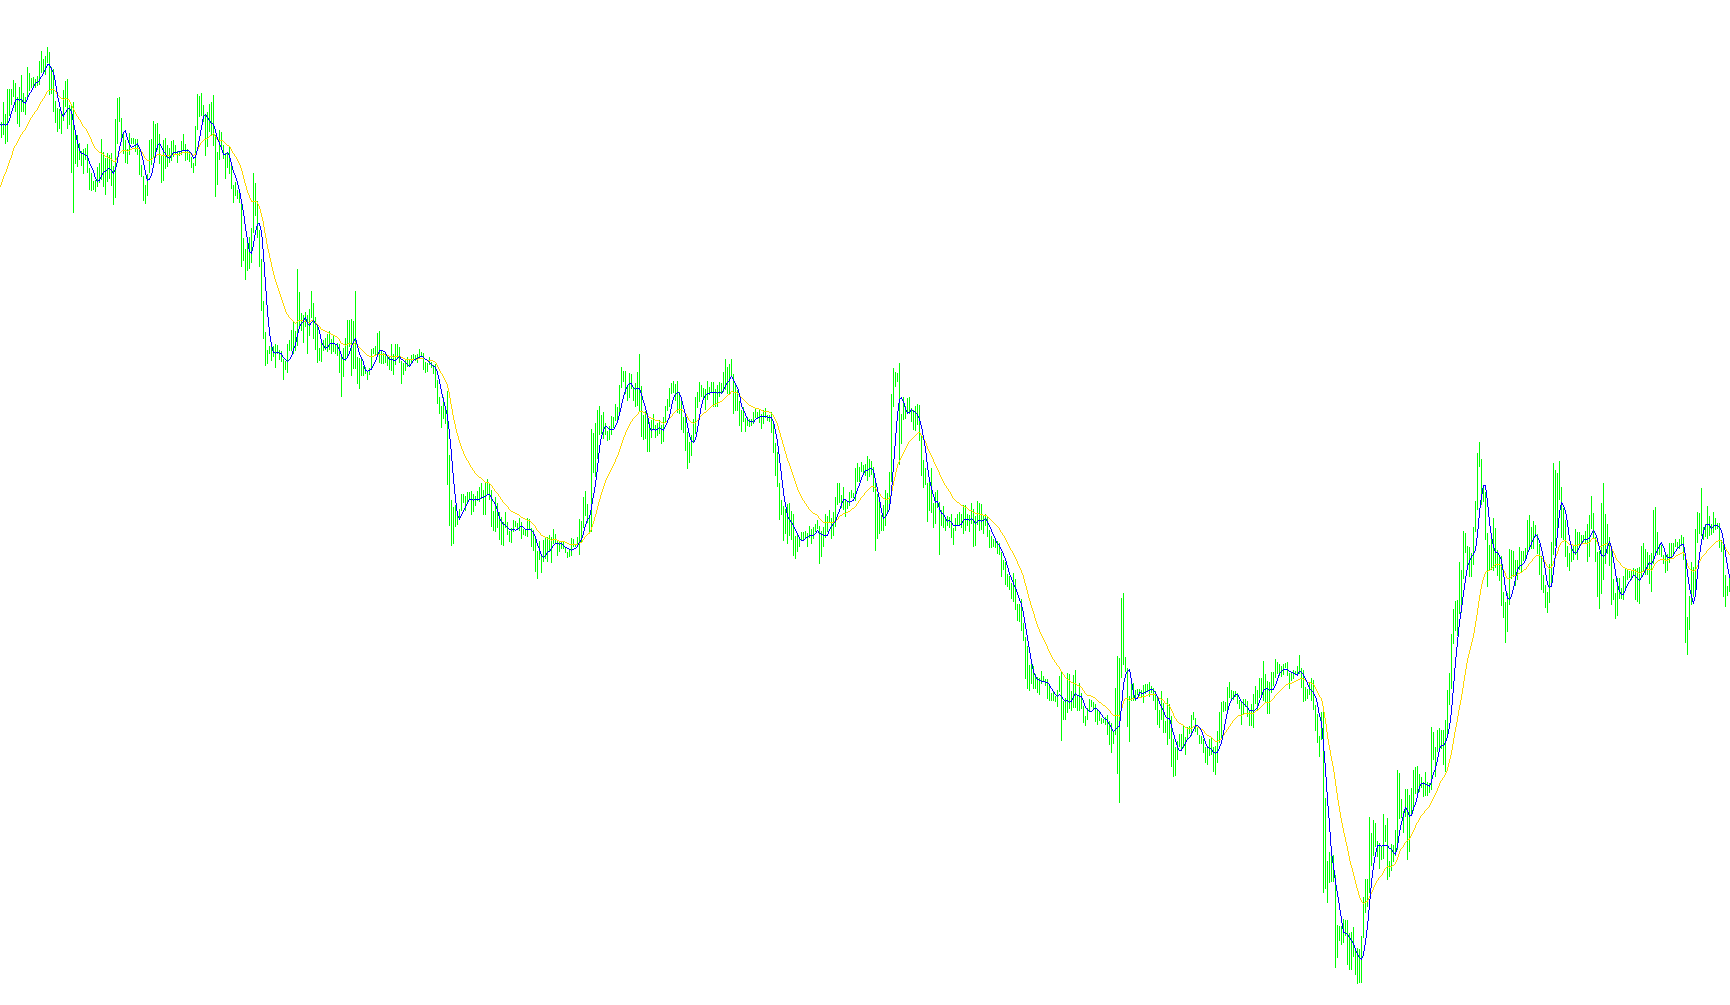
This tool is designed to enhance your visual analysis of the markets by plotting two specific moving average lines directly onto your trading chart. It is based on a strategy often referred to as the "Vegas Model," which focuses on identifying price trends and momentum by smoothing out market noise.
How it Works
The script processes historical price data to calculate and display two distinct types of averages simultaneously:
- The Long-Term Trend Line (Green): This line uses an Exponential Moving Average (EMA) with a 21-period setting. Unlike a standard average, the "Exponential" method gives more significance to recent price action, allowing the line to react more quickly to new information while still providing a clear view of the overall trend.
- The Short-Term Momentum Line (Blue): This line uses a Simple Moving Average (SMA) with a 5-period setting. This provides a much "tighter" look at recent price movements, helping you see immediate shifts in price direction.
Key Features
- Visual Clarity: By displaying both lines on the chart, you can easily observe the relationship between short-term momentum and long-term trends.
- Price Median Basis: The calculations are based on the "Median Price," which takes into account the high, low, open, and close of each candle to provide a balanced average point.
- Real-Time Updates: The script automatically updates as new data comes in, ensuring that both the Green and Blue lines reflect the most current market conditions.
Practical Use
Traders typically use these two lines together to identify "crossovers" or changes in momentum. When the short-term blue line interacts with the longer green line, it can signal a potential shift in the market's direction, helping you visualize whether the price is gaining strength or losing steam relative to its recent history.
Indicators Used
Miscellaneous
12
Views
0
Downloads
0
Favorites
4hVegasMetaTraderWeeklyChart(2)
//+------------------------------------------------------------------+
//| 4Hour Vegas Model - Weekly Chart MA lines                        |
//|                                                           Spiggy |
//|                                                                  |
//+------------------------------------------------------------------+
#property copyright "Spiggy"
#property link      ""

#property indicator_chart_window
#property indicator_buffers 2
#property indicator_color1 Green
#property indicator_color2 Blue


//---- input parameters

//---- buffers
double ExtMapBuffer1[];
double ExtMapBuffer2[];

//+------------------------------------------------------------------+
//| Custom indicator initialization function                         |
//+------------------------------------------------------------------+
int init()
  {
//---- indicators
   SetIndexStyle(0,DRAW_LINE);
   SetIndexBuffer(0,ExtMapBuffer1);
   SetIndexStyle(1,DRAW_LINE);
   SetIndexBuffer(1,ExtMapBuffer2);

//----
   return(0);
  }
//+------------------------------------------------------------------+
//| Custor indicator deinitialization function                       |
//+------------------------------------------------------------------+
int deinit()
  {
//----

//----
   return(0);
  }
//+------------------------------------------------------------------+
//| Custom indicator iteration function                              |
//+------------------------------------------------------------------+
int start()
{
  int    limit;
  int    counted_bars=IndicatorCounted();
  double EMA21;
  double SMA5;

  //---- check for possible errors
  if(counted_bars<0) return(-1);
  //---- last counted bar will be recounted
  if(counted_bars>0) counted_bars--;
  limit=Bars-counted_bars;
  //---- main loop
  for(int i=0; i<limit; i++)
  {
    //---- ma_shift set to 0 because SetIndexShift called abowe
    EMA21=iMA(NULL,0,21,0,MODE_EMA,PRICE_MEDIAN,i);
    SMA5 =iMA(NULL,0,5,0,MODE_SMA,PRICE_MEDIAN,i);

    ExtMapBuffer1[i] = EMA21;
    ExtMapBuffer2[i] = SMA5;
  }

  return(0);
}
//+------------------------------------------------------------------+
Comments