Indicator

MultiLevelPriceAlerts

multima
Indicator

multima

iMA

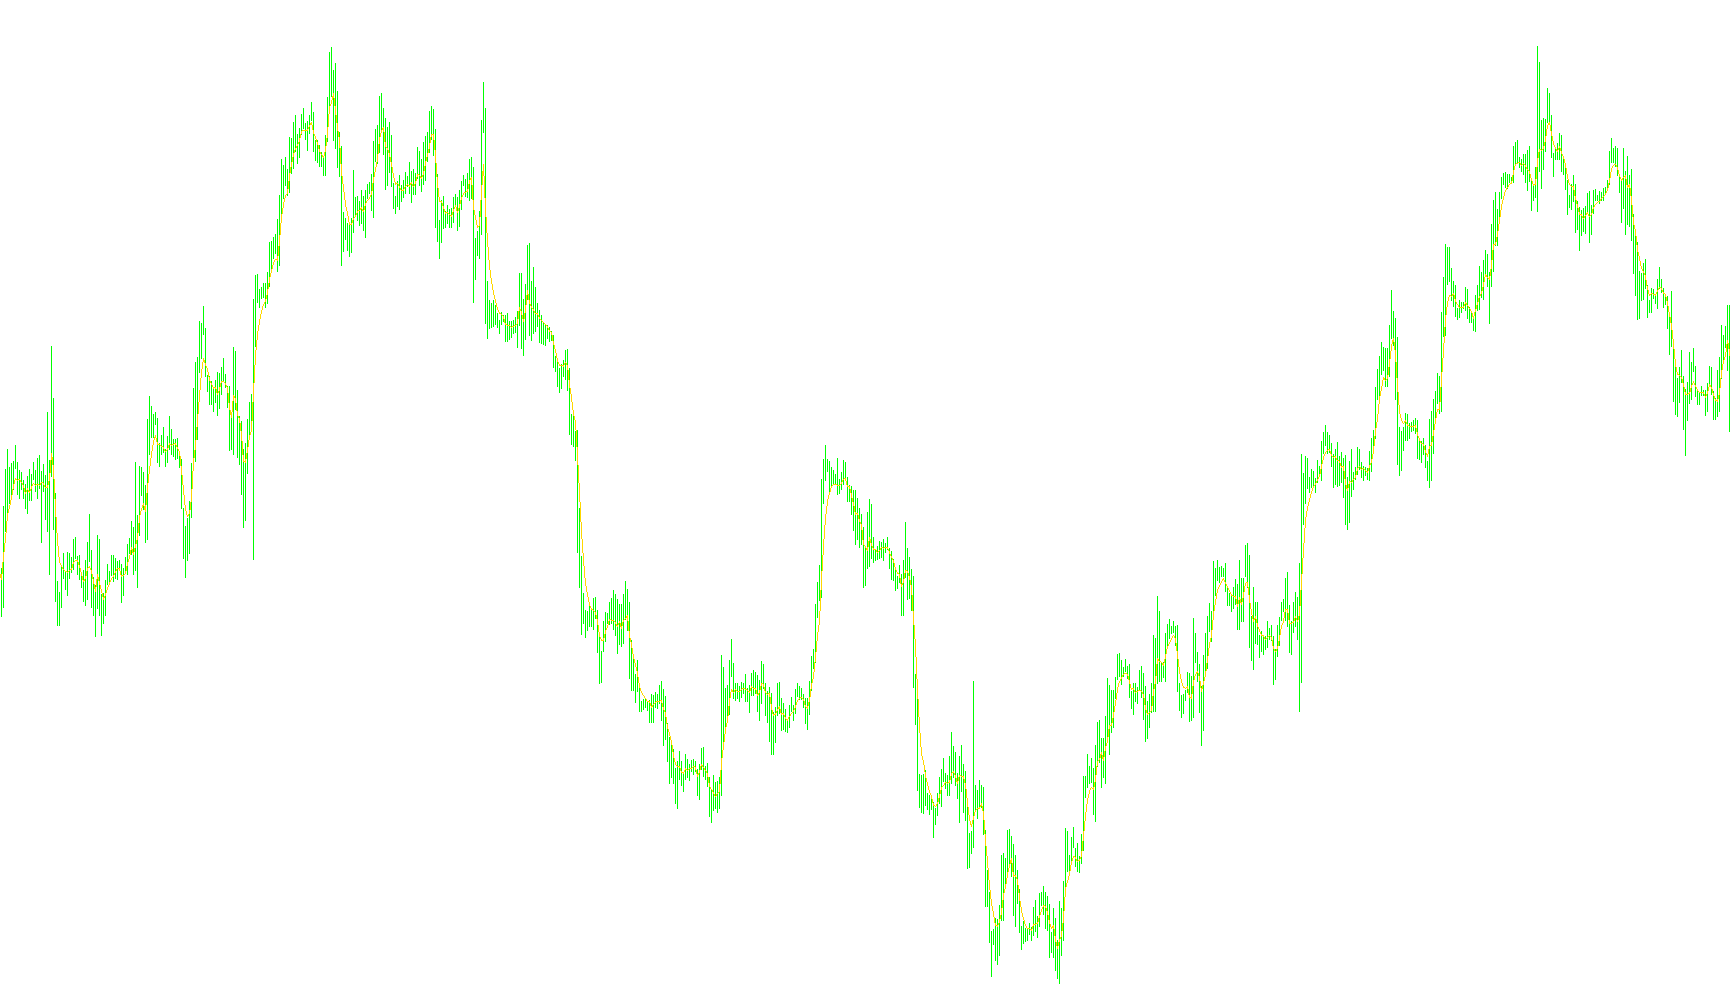
This indicator tracks price dynamics by calculating three distinct moving averages with varying periods and adjustable smoothing methods to visualize multi-timeframe trends.

MultiPairTrend''
Indicator

MultiPairTrend''

iMA

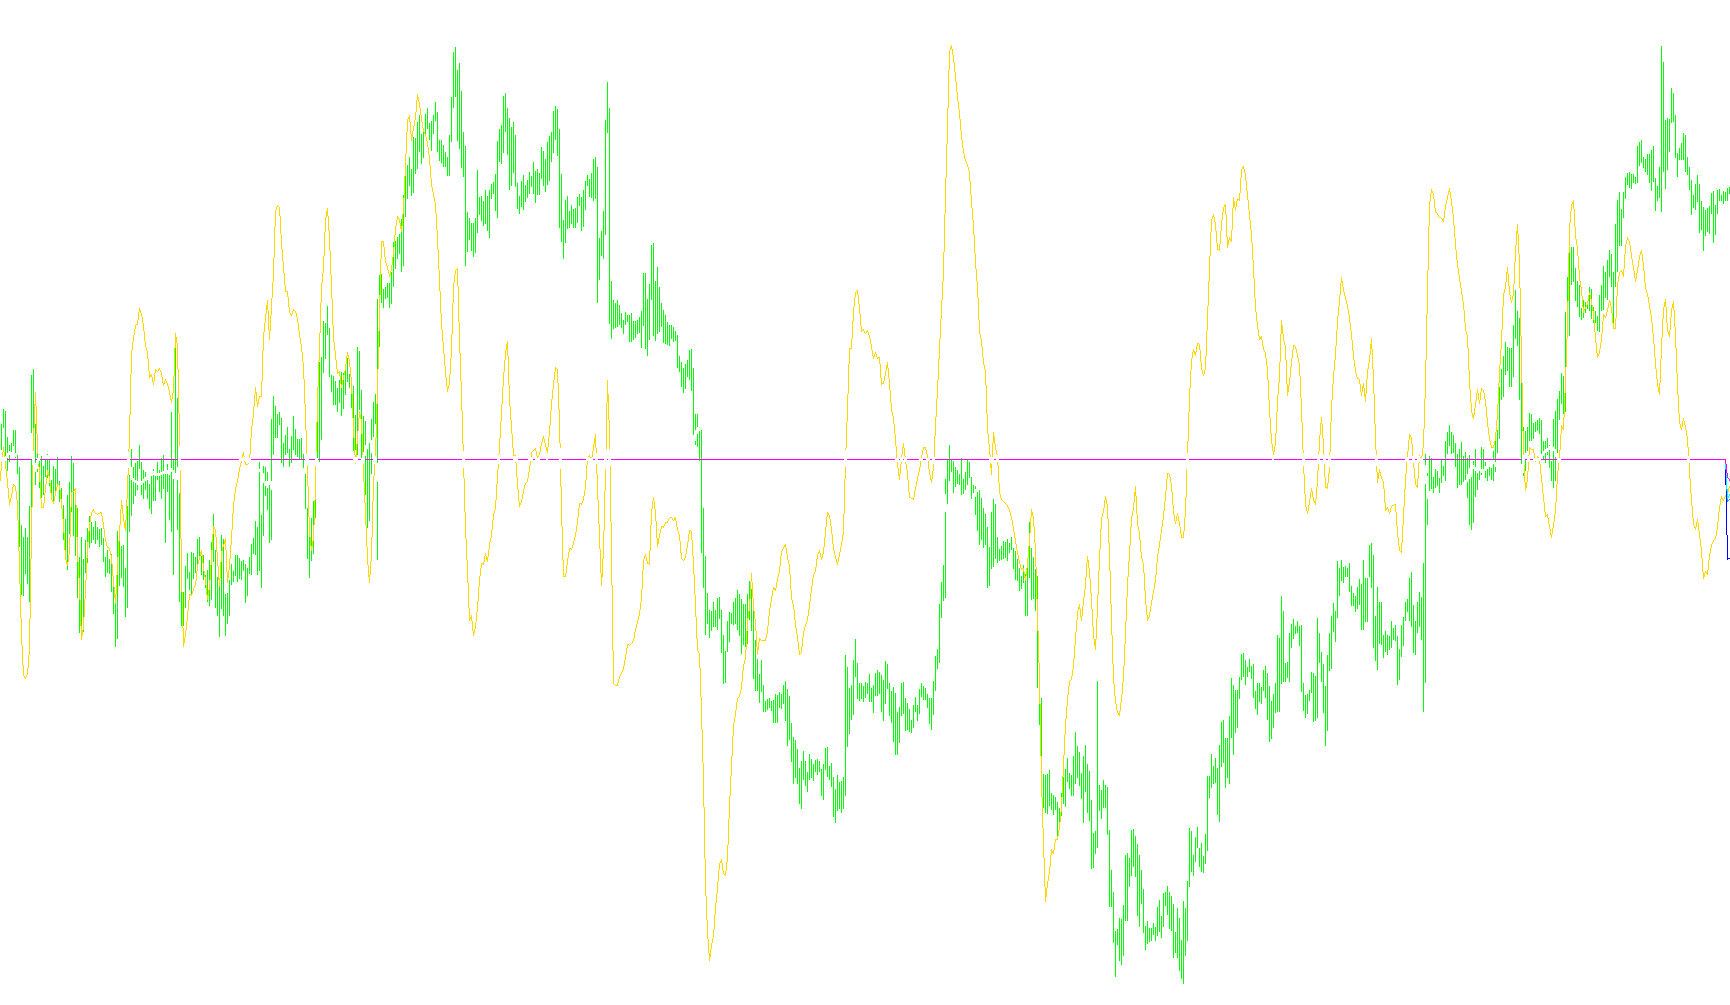
This indicator calculates the differential momentum of multiple major currency pairs relative to the USD using Linear Weighted Moving Averages to derive a composite basket index.

MultiPairTrend''_
Indicator

MultiPairTrend''_

iMA

The indicator calculates the weighted price momentum of multiple global currency pairs against the USD by measuring the delta of linear weighted moving averages.

MultiPairTrend
Indicator

MultiPairTrend

iMA

This indicator calculates the spread between short and long-term linear weighted moving averages across multiple currency pairs to derive a synthetic USD strength index.

MultipleMA
Indicator

MultipleMA

iMAiMAOnArray

This indicator calculates a hierarchical sequence of moving averages where each subsequent layer applies its smoothing method to the previous average's output, creating a multi-layered trend filtering system.

Multiplema_www.forex-instruments.info
Indicator

Multiplema_www.forex-instruments.info

iMAiMAOnArray

This indicator computes a nested hierarchy of three moving averages where each successive layer calculates its value based on the previous average's output to filter market noise.

MultiplePivotsV2
Indicator

MultiplePivotsV2

This indicator dynamically renders concurrent support and resistance levels by synthesizing Standard, Camarilla, Fibonacci, and Mid-point pivot methodologies based on historical price extremes.

MultiplePivotsV2_v1
Indicator

MultiplePivotsV2_v1

This indicator dynamically projects various price action levels including Standard, Camarilla, Fibonacci, and Mid-point pivots based on previous daily high, low, and close data.

MultiSSRC
Indicator

MultiSSRC

This indicator aggregates nested SSRC (Smoothed Stochastic RSI Curve) data across multiple concurrent timeframes to synchronize momentum trends and identify structural market shifts.

MultiSSRCplusSM
Indicator

MultiSSRCplusSM

This indicator synchronizes multi-timeframe SSRC trend data with a dual-layer Snake Mood filter to identify high-probability momentum shifts across nested temporalities.

MultiStochastics
Indicator

MultiStochastics

iStochastic

This indicator synchronizes and visualizes main stochastic oscillators across seven distinct timeframes simultaneously to identify momentum alignment.
MultiStrend
Indicator

MultiStrend

This indicator synchronizes and overlays trend signals from three consecutive timeframes to provide a multi-layered directional bias analysis.

Indicator

multisymbol_color-RSI_LQ_1.0

iRSI
multisymbol_color-RSI_LQ_1[1].0
Indicator

multisymbol_color-RSI_LQ_1[1].0

iRSI

This indicator visualizes relative strength momentum by mapping RSI values into a multi-colored histogram that distinguishes between bearish, bullish, and neutral trend intensities.

multisymbol_color_RSI_LQ_1.0M6
Indicator

multisymbol_color_RSI_LQ_1.0M6

iRSI

This indicator visualizes Relative Strength Index momentum by categorizing price action into distinct color-coded intensity zones based on threshold breaches.

multisymbol_color_Stochastic_LQ_1.0M6
Indicator

multisymbol_color_Stochastic_LQ_1.0M6

iStochastic

This indicator visualizes momentum intensity by mapping Stochastic Oscillator values into color-coded histogram blocks that differentiate between bullish, bearish, and neutral market zones.

MultiTrandOscilator2
Indicator

MultiTrandOscilator2

iMA

This indicator calculates the relative momentum of multiple currency pairs simultaneously to synthesize a composite trend oscillator based on inter-market correlations.

MultiTrend(1)
Indicator

MultiTrend(1)

iADX

This indicator identifies momentum reversals by dynamically calculating a threshold range based on ADX-adjusted lookback periods and identifying price breaches beyond statistical extremes.

MultiTrend
Indicator

MultiTrend

iADX

This indicator identifies price extremes by dynamically calculating lookback periods based on the Average Directional Index to detect structural trend reversals.

Multiwprhist
Indicator

Multiwprhist

iWPR

This indicator aggregates Williams Percent Range values across four major currency pairs to derive a unified bullish or bearish bias based on collective momentum thresholds.

MultiwprhistUSD
Indicator

MultiwprhistUSD

iWPR

This indicator synchronizes Williams Percent Range data across multiple major currency pairs to derive a composite bullish or bearish sentiment histogram based on collective momentum shifts.

MultiZigZag
Indicator

MultiZigZag

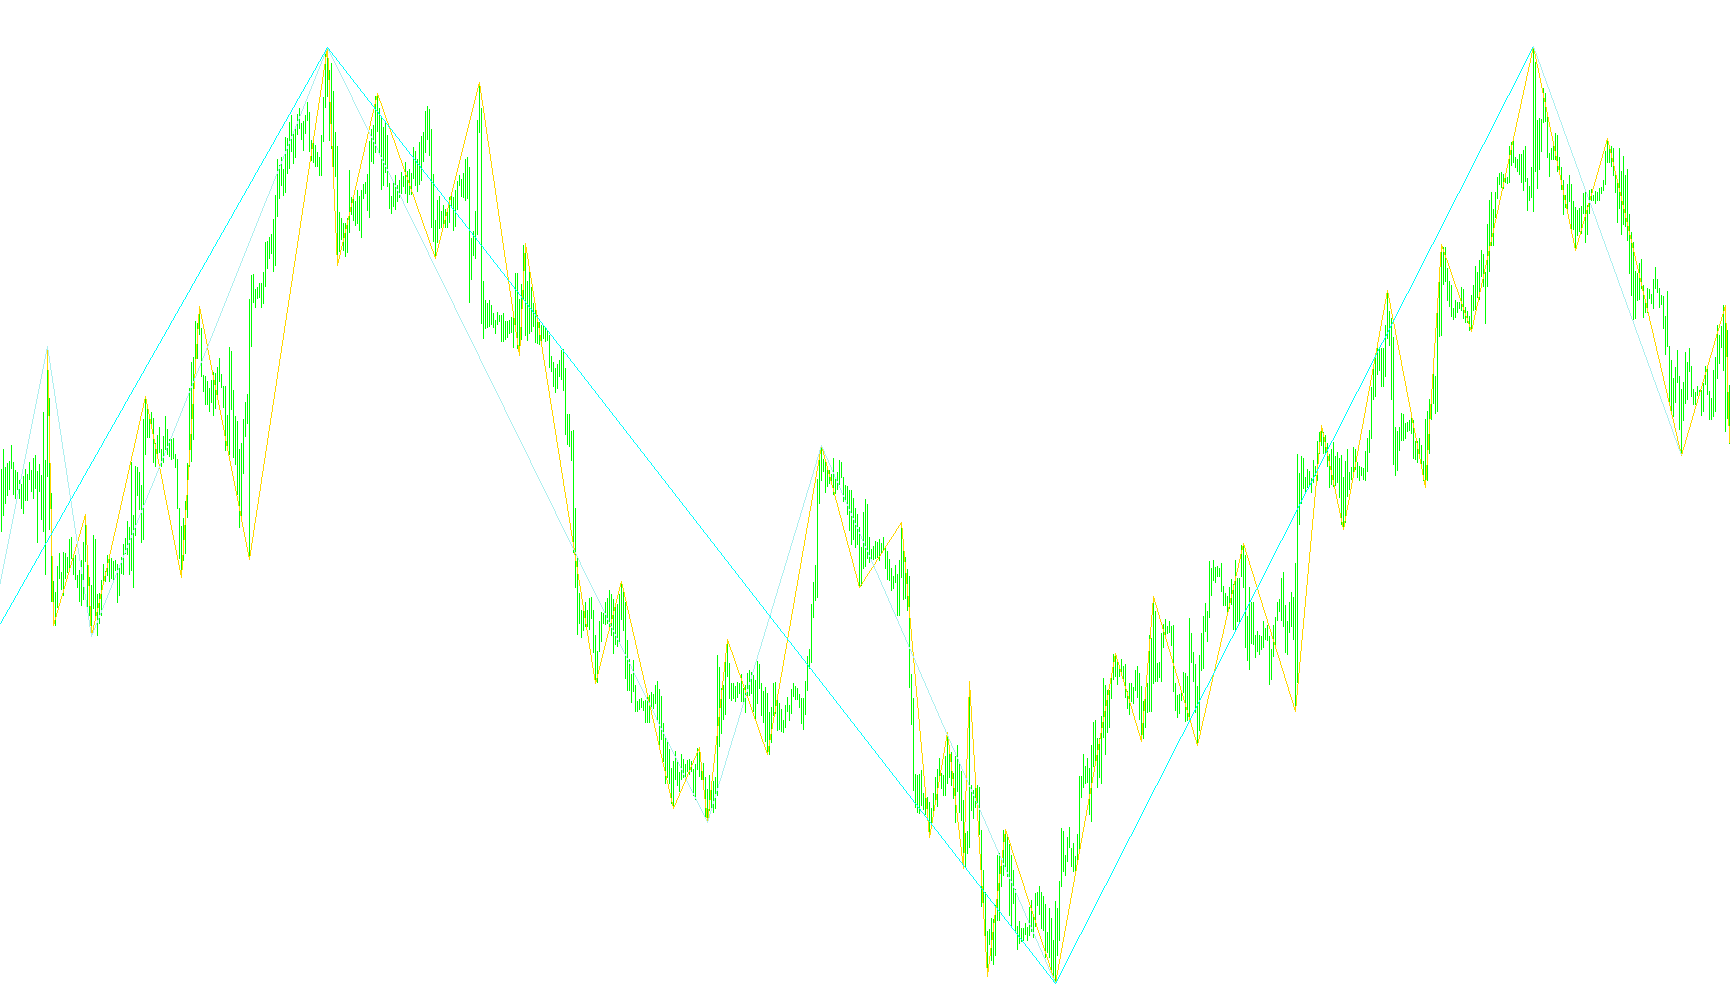
This indicator projects three independent ZigZag trajectories simultaneously by aggregating price action across multiple predefined timeframes into a single unified chart view.

multi_2x2_MA
Indicator

multi_2x2_MA

iMA

This indicator quantifies the dynamic price gap between short-term and long-term moving averages across two distinct currency pairs, normalized by their respective point values.

Multi_Indic
Indicator

Multi_Indic

This indicator concurrently retrieves and plots data from five distinct external technical indicators into a single separate window for synchronized multi-factor analysis.

Multi_Indic_BR
Indicator

Multi_Indic_BR

Aggregates and normalizes diverse momentum oscillators including RSI, CCI, WPR, and RVI into a single multi-buffer visual for synchronized market sentiment analysis.

Indicator

Multi_Oscillator_v1

iCCIiMFIiRSIiStochastic
Multi_RSI(AM)
Indicator

Multi_RSI(AM)

This indicator visualizes the synchronized momentum of eight distinct Relative Strength Index periods to identify high-probability trend exhaustion and price velocity.

Multi_RSI_AM_
Indicator

Multi_RSI_AM_

This indicator visualizes the synchronization of eight distinct Relative Strength Index calculations across varying time horizons to identify multi-period momentum shifts.

MultyMA For Usd
Indicator

MultyMA For Usd

iMA

This indicator calculates the weighted difference between short-term and long-term moving averages across multiple currency pairs to synthesize a diversified momentum signal.

MultySymbolsChart
Indicator

MultySymbolsChart

This indicator synchronizes and normalizes price action from multiple currency pairs into a single unified chart to highlight relative market movements and cross-asset volatility.

MultySymbolsChart_v2_2
Indicator

MultySymbolsChart_v2_2

This indicator aggregates and normalizes price action across multiple currency pairs into a unified visual space to identify relative volatility and momentum patterns.

MurrayMath
Indicator

MurrayMath

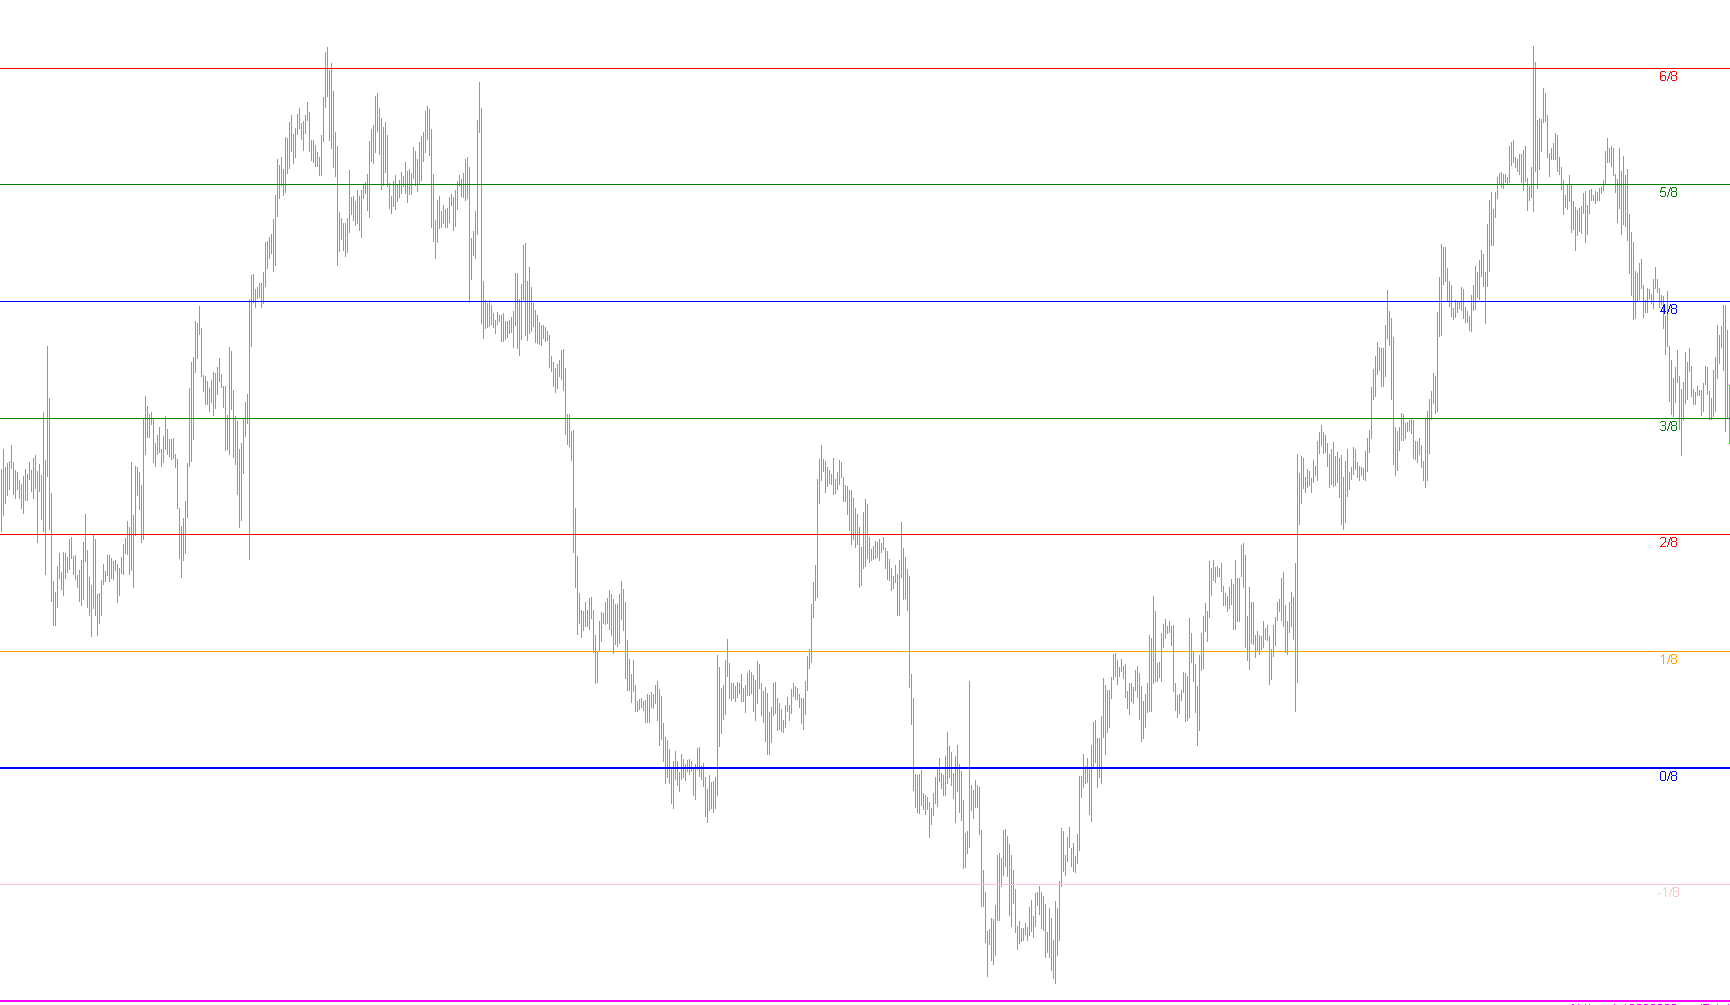
This indicator utilizes a fractal-based octave decomposition to segment market volatility into a multi-layered support and resistance grid, identifying specific equilibrium zones and potential reversal pivot points.

MurrayMath_v1
Indicator

MurrayMath_v1

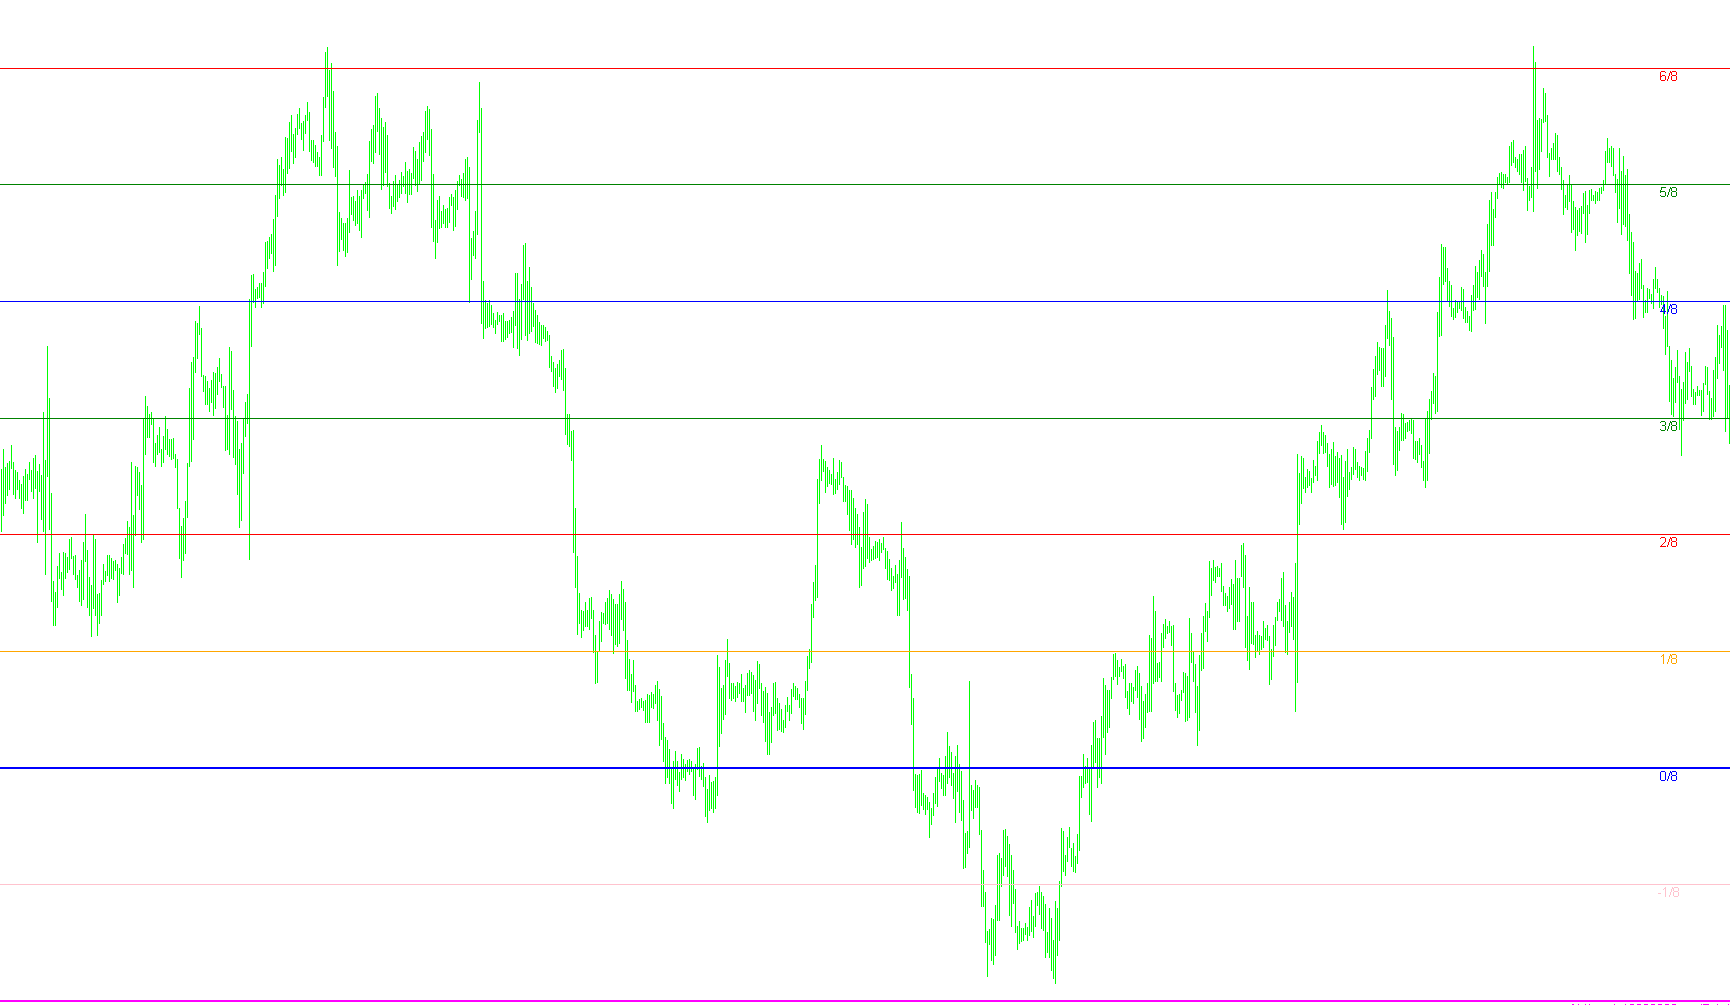
This indicator dynamically projects a multi-level horizontal price grid by calculating the fractal recursive range and identifying pivotal structural boundaries.

Murrey Math Lines F
Indicator

Murrey Math Lines F

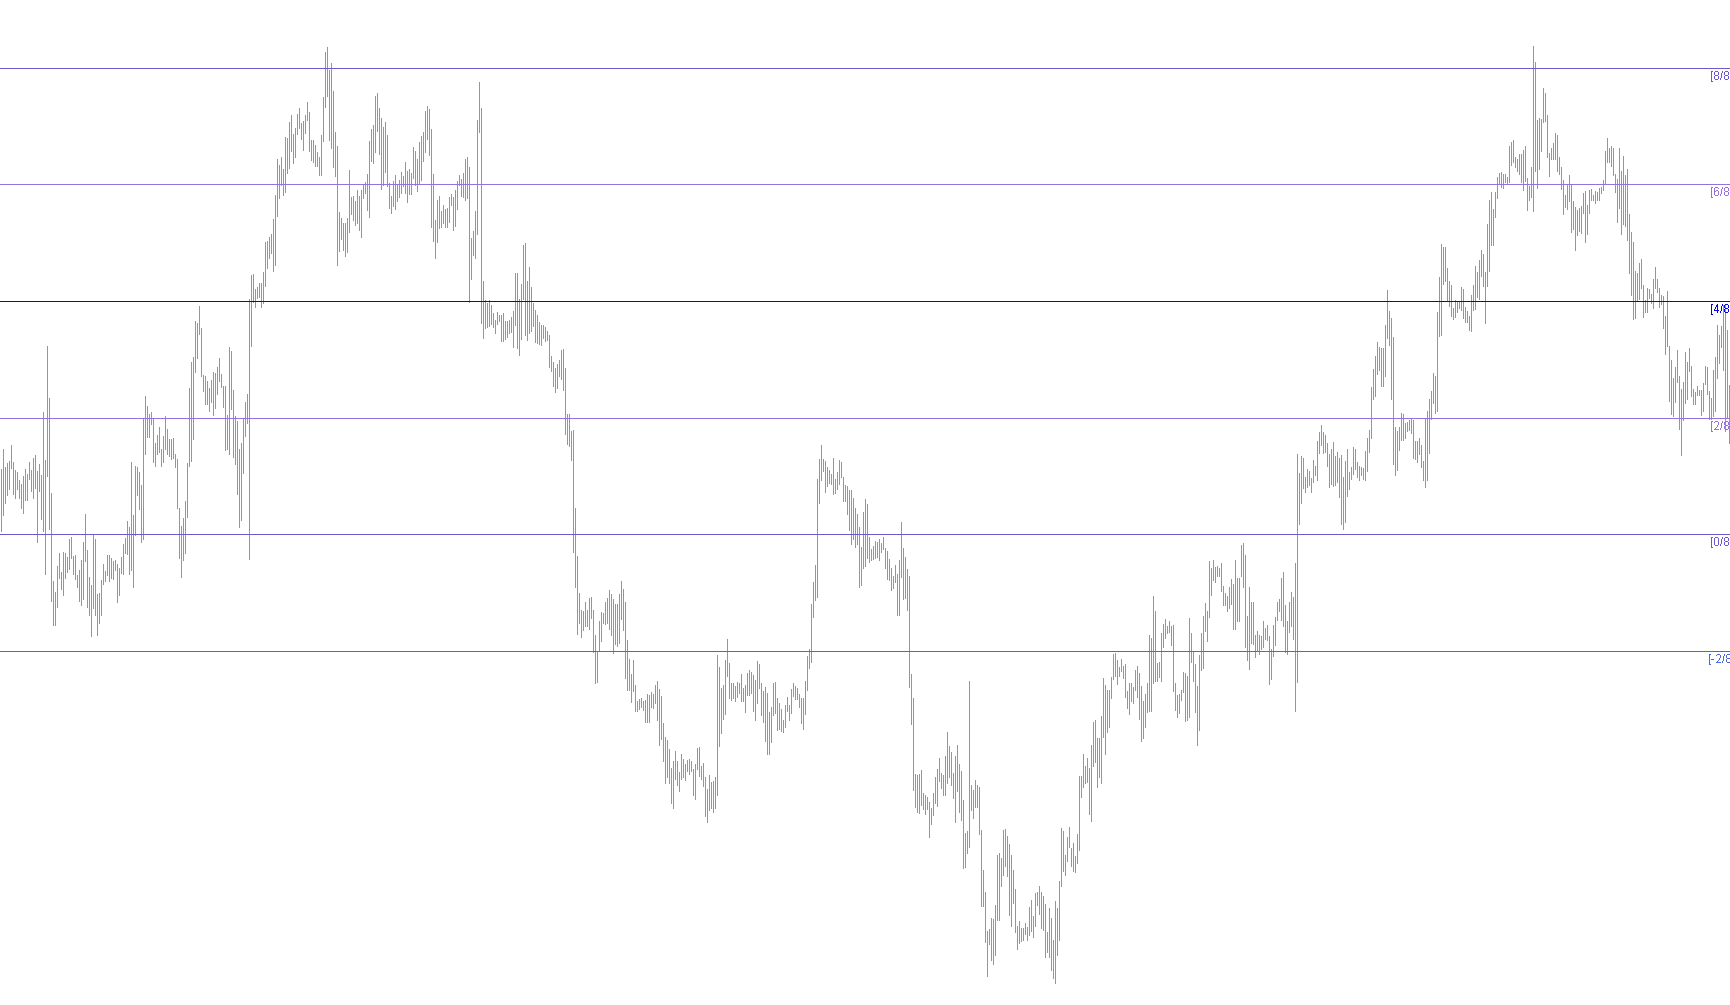
This indicator utilizes a fractal-based logarithmic scale to segment price action into eight distinct octaves, identifying high-probability support and resistance levels.

Murrey Math Lines F_v1
Indicator

Murrey Math Lines F_v1

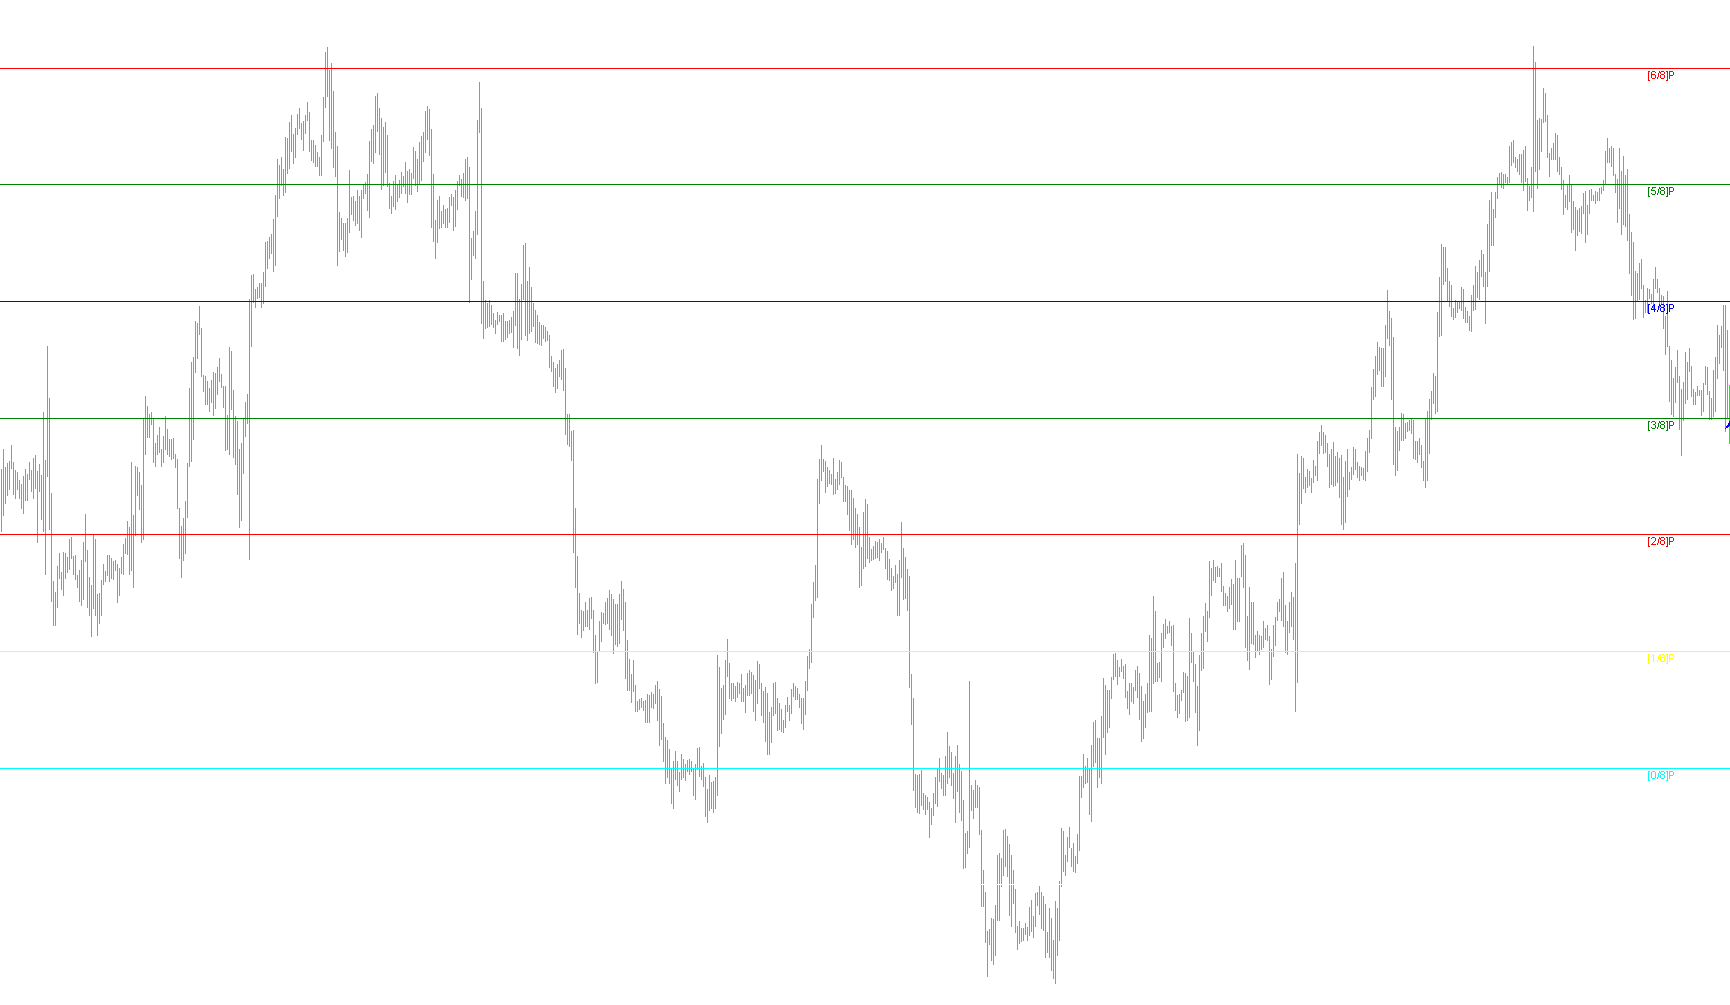
This indicator utilizes fractal geometry and logarithmic scaling to partition market volatility into eight distinct octaves, identifying precise zones of equilibrium, premium distribution, and major structural pivot points.

MurreyMath1[1].0
Indicator

MurreyMath1[1].0

This indicator dynamically calculates price equilibrium by partitioning the trading range into eight distinct octaves to identify pivotal support, resistance, and trend reversal zones.

Murrey_Math
Indicator

Murrey_Math

This indicator dynamically calculates multi-layered price zones by blending fractal geometry with octaval scaling to identify high-probability pivot points and trading range boundaries.

Murrey_Math_Line_X
Indicator

Murrey_Math_Line_X

This indicator identifies multi-layered support and resistance zones by calculating fractal octaves to map high-probability reversal points and premium trading boundaries.

Murrey_Math_Line_X_eng
Indicator

Murrey_Math_Line_X_eng

This indicator utilizes fractal-based logarithmic scaling to project eight distinct price equilibrium levels, identifying high-probability pivot zones and extreme overbought/oversold territories.

Murrey_Math_Line_X_eng_v1
Indicator

Murrey_Math_Line_X_eng_v1

This indicator projects a multi-layered support and resistance framework by partitioning price action into an eight-part octave based on fractal range analysis.

Murrey_Math_Modified
Indicator

Murrey_Math_Modified

This indicator dynamically partitions price action into harmonic octaves and calculates multi-level support and resistance zones based on fractal geometric ratios.

Murrey_Math_Modified1
Indicator

Murrey_Math_Modified1

This indicator calculates dynamic price equilibrium zones by identifying fractal octaves based on specific price ranges and plotting multi-level support and resistance levels.

Murrey_Math_Modified1_v1
Indicator

Murrey_Math_Modified1_v1

This indicator identifies key structural price levels by calculating fractal-based octaves and mapping geometric distribution zones across a defined range.

Murrey_Math_Modified1_v2
Indicator

Murrey_Math_Modified1_v2

This indicator identifies market structural boundaries by calculating fractal price ranges and subdividing the resulting range into precise octaves for equilibrium analysis.

Murrey_Math_Modified_v1
Indicator

Murrey_Math_Modified_v1

This indicator dynamically segments price action into octaves using logarithmic fractal scaling to project a multi-layered horizontal grid of structural equilibrium zones.

Murrey_Math_MT4_Even
Indicator

Murrey_Math_MT4_Even

This indicator utilizes logarithmic fractal scaling to project 13 dynamic price levels that identify major structural pivots, premium zones, and exhaustion points.

Murrey_Math_MT4_Period_VG
Indicator

Murrey_Math_MT4_Period_VG

This indicator identifies key psychological price levels by calculating an octave-based range and plotting thirteen distinct support and resistance zones based on fractal symmetry.

Murrey_Math_MT4_Period_VG_001
Indicator

Murrey_Math_MT4_Period_VG_001

This indicator utilizes fractal geometry and logarithmic scaling to project a multi-level octic grid of dynamic pivot zones, identifying key market equilibrium points and extreme exhaustion levels.

Murrey_Math_MT4_Period_VG_v1
Indicator

Murrey_Math_MT4_Period_VG_v1

This indicator dynamically segments price action into an eight-part octave scale to identify high-probability pivot zones, premium/discount areas, and structural reversal thresholds.