MultiTrend(1)
Download script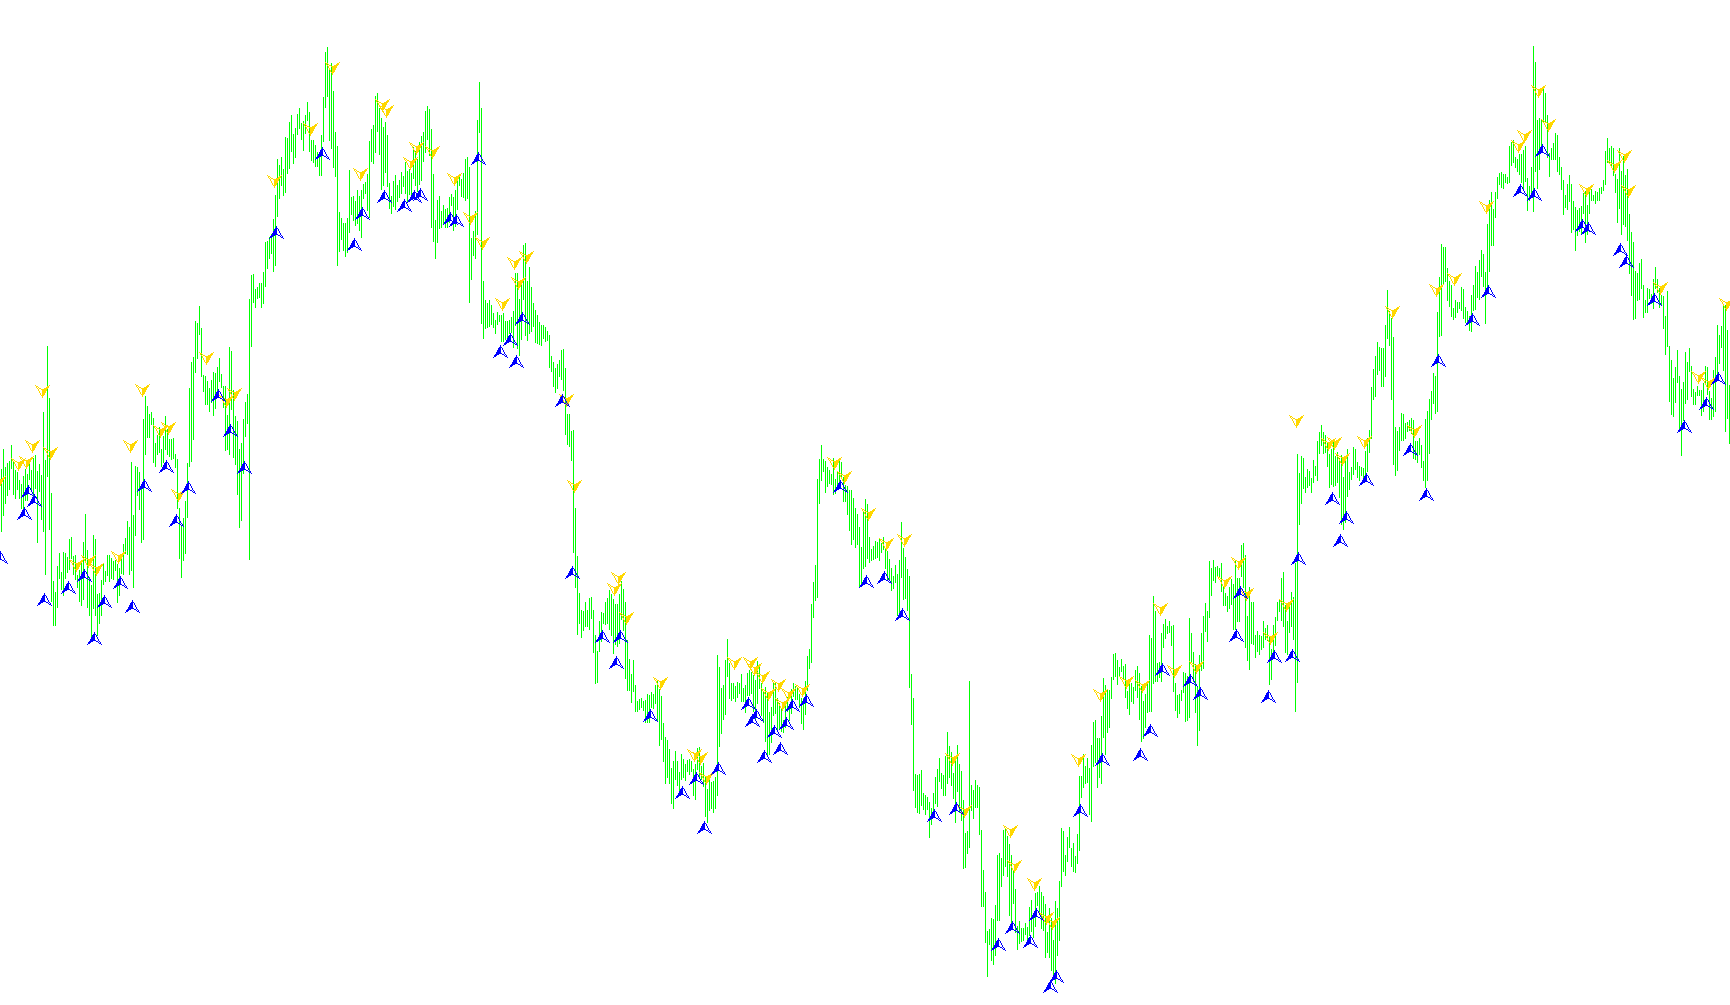
This script is designed as a technical analysis tool for the MetaTrader platform, specifically created to identify potential trend reversals and entry points by analyzing price action history. It functions by dynamically calculating market volatility and identifying specific price "breakout" zones.
Core Logic Overview
The indicator operates by scanning historical price data to determine the current momentum of the market. Instead of using a fixed timeframe, it adapts its calculations based on the Average Directional Index (ADX). This means that during periods of high volatility, the script focuses on a smaller window of data, while during quieter markets, it expands its view to capture broader trends.
How it Analyzes the Market
- Volatility Measurement: The tool first calculates the average range of price movement over a specific period. This helps the script understand the "normal" heartbeat of the market.
- Dynamic Boundary Identification: Using the volatility data, the script identifies two critical price boundaries: a "Maximum" and a "Minimum" level within a moving window. It then applies a percentage-based buffer (the K factor) to these levels to create specialized support and resistance zones.
- Signal Detection: The logic looks for specific interactions between the current price and these boundaries:
- Buy Signals: If the price opens significantly below a calculated minimum boundary, the script scans forward to see if a reversal toward the upward trend is confirmed.
- Sell Signals: Conversely, if the price opens above a calculated maximum boundary, it looks for confirmation of a downward move.
Visual Output
The script translates these complex calculations into visual cues directly on your trading chart:
- Red Arrows: These appear at specific coordinates to signal potential downward movements or "sell" opportunities based on the breach of upper boundaries.
- Yellow Arrows: These appear to highlight potential upward movements or "buy" opportunities when the price reacts from lower boundaries.
Summary for the Trader
Essentially, this tool filters out market noise by looking for significant "over-extensions" in price. It identifies moments where the price has pushed too far in one direction relative to recent volatility and marks the points where a counter-move (a trend reversal) is statistically likely to occur, providing you with visual cues to support your trading decisions.
//+------------------------------------------------------------------+
//|                                          MultiTrend_Signal_KVN.mq4 |
//|                                                   Vladimir Korykin |
//|                                             koryvladimir@inbox.ru |
//+------------------------------------------------------------------+
#property copyright "Vladimir Korykin"
#property link      "koryvladimir@inbox.ru"

#property indicator_chart_window
#property indicator_buffers 2
#property indicator_color1 Red
#property indicator_color2 Yellow

extern   int      K=48;
extern   double   Kstop=0.5;
extern   int      Kperiod=150;
extern   int      PerADX=14;
extern   int      CountBars=2800;

double ind0[];
double ind1[];

int init()
{
   SetIndexStyle(0,DRAW_ARROW,EMPTY,2);
   SetIndexArrow(0,218);
   SetIndexBuffer(0,ind0);
   SetIndexEmptyValue(0,0.0);
   SetIndexStyle(1,DRAW_ARROW,EMPTY,2);
   SetIndexArrow(1,217);
   SetIndexBuffer(1,ind1);
   SetIndexEmptyValue(1,0.0);

   return(0);
}

int deinit()
{
   return(0);
}

int start()
{
   int loopbegin=0, SSP=0, i1=0, MyBars=0;
   double Range=0,AvgRange=0;
   double smin=0, smax=0, SsMax=0, SsMin=0,val1=0,val2=0,value3=0;
   int table1[], table2[];
   double Table_value2[];

   ArrayResize(Table_value2, Bars);
   ArrayResize(table1, Bars);
   ArrayResize(table2, Bars);

   bool first=true;

   if (first)
   {
	  loopbegin = CountBars+1;
	  MyBars=loopbegin;
	  if (loopbegin < 0) return(0);
	  first = false;
   }

   for (int i = loopbegin; i>=0; i--)
   {
//      SSP=MathCeil(Kperiod/iADX(NULL, 0, PerADX, PRICE_CLOSE, MODE_MAIN, 1));
      SSP=MathCeil(Kperiod/iADX(NULL, 0, PerADX, PRICE_OPEN, MODE_MAIN, 1));
   	Range=0;
	   AvgRange=0;
   	for (i1=i; i1<=i+SSP; i1++)
         AvgRange=AvgRange+MathAbs(High[i1]-Low[i1]);
	   Range=AvgRange/(SSP+1);

      SsMax = High[Highest(NULL,0,MODE_HIGH,SSP,i)];
      SsMin = Low[Lowest(NULL,0,MODE_LOW,SSP,i)];
      smin = SsMin+(SsMax-SsMin)*K/100;
      smax = SsMax-(SsMax-SsMin)*K/100;

	   table1[i]=i;
//	   Table_value2[i]=Close[i];
	   Table_value2[i]=Open[i];
	   table2[i]=0;
	   val1=0;
	   val2=0;
	   value3=0;
//	   if (Close[i]<smin)
	   if (Open[i]<smin)
		{
		    i1=1;
		    table2[i]=-1;
		    while (table2[i+i1]>-1 && table2[i+i1]<1 && Table_value2[i+i1]>0)
            i1=i1+1;
	       if (table2[i+i1]==1)
			 {
			   value3=High[i]+Range*Kstop;
			   val1=value3;
			 }
		}
//	   if (Close[i]>smax)
	   if (Open[i]>smax)
		{
		    i1=1;
		    table2[i]=1;
		    while (table2[i+i1]>-1 && table2[i+i1]<1 && Table_value2[i+i1]>0)
            i1=i1+1;
		    if (table2[i+i1]==-1)
			 {
			   value3=Low[i]-Range*Kstop;
			   val2=value3;
			 }
		}

      ind0[i]=val1;
      ind1[i]=val2;
      loopbegin=loopbegin+1;
      if (MyBars<Bars && i==0)
	   {
	       for (i1=72; i1>=2; i1--)
		    {
			   table1[i1]=table1[i1-1];
			   Table_value2[i1]=Table_value2[i1-1];
			   table2[i1]=table2[i1-1];
		    }
	       MyBars=MyBars+1;
	   }
   }

   return(0);
}
Comments