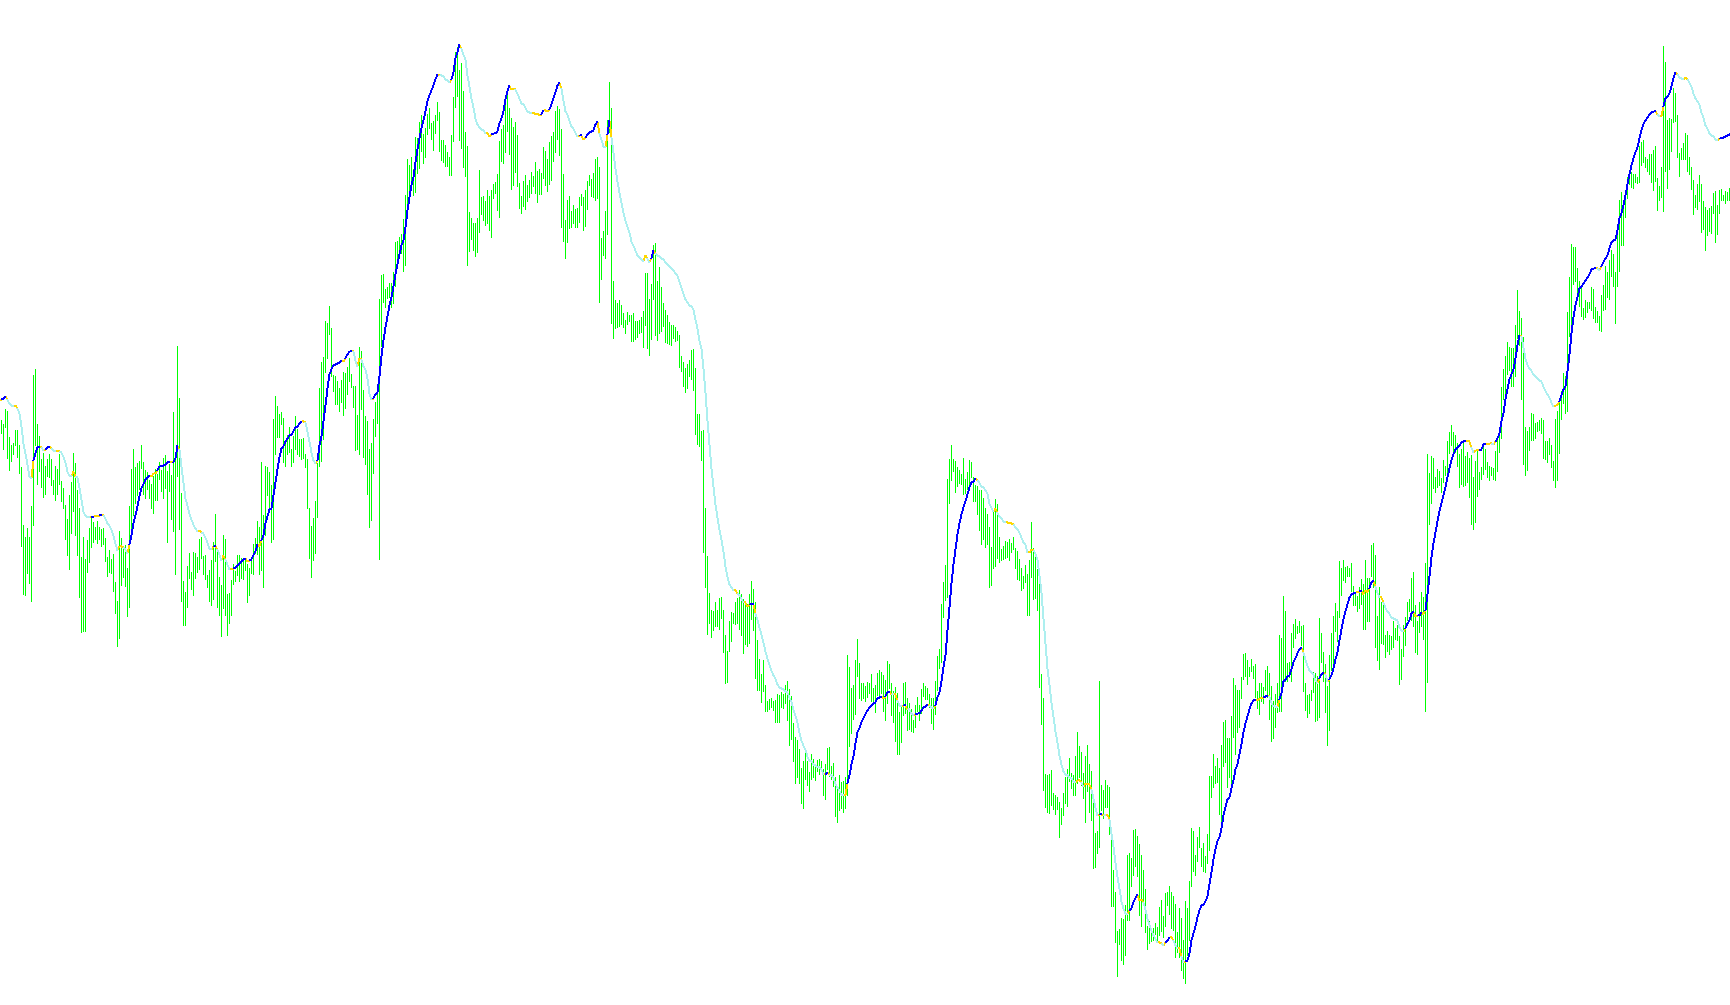
MTF_FXSnipErgoCCI_BarM-1
Indicator

MTF_FXSnipErgoCCI_BarM-1

This indicator synchronizes and visualizes bullish and bearish sentiment across four concurrent higher-timeframe dimensions by aggregating ergodic trigger data.

MTF_FXSnipErgoCCI_BarM
Indicator

MTF_FXSnipErgoCCI_BarM

This indicator aggregates multi-timeframe price action data from a secondary ergodic trigger to visualize synchronized bullish and bearish sentiment across four distinct temporal horizons simultaneously.

MTF_FXSnipErgoCCI_BarM6
Indicator

MTF_FXSnipErgoCCI_BarM6

This indicator aggregates synchronized bull/bear polarity signals across four distinct temporal horizons to visualize multi-layered trend convergence.

Indicator

MTF_FXSnipersErgodicCCITrigger

Indicator

MTF_Heiken_Ashi

Indicator

MTF_Heiken_Ashi_Smoothed

Indicator

MTF_Heiken_Ashi_v1

Indicator

MTF_Heiken_Ashi_[sw]

Indicator

MTF_Heiken_Ashi_[sw]_v1

MTF_HI_LOW
Indicator

MTF_HI_LOW

This indicator dynamically plots historical and real-time price extremes across daily, weekly, and monthly intervals to identify structural support and resistance zones.

MTF_HI_LOW_v1
Indicator

MTF_HI_LOW_v1

This indicator dynamically projects historical and real-time high/low price levels, pivot points, and structural rectangles across daily, weekly, and monthly temporalities to identify key liquidity zones.

MTF_HI_LOW_v1_v1
Indicator

MTF_HI_LOW_v1_v1

This indicator projects synchronized historical and real-time high, low, and pivot levels across daily, weekly, and monthly temporalities to map structural liquidity zones.

Indicator

MTF_Hull_HAMA

MTF_Ichimoku_v1
Indicator

MTF_Ichimoku_v1

This indicator projects multi-timeframe Ichimoku Kinko Hyo components onto the current chart to synchronize global momentum and trend boundaries across varying temporal scales.

MTF_Instant Trendline
Indicator

MTF_Instant Trendline

This indicator aggregates directional trend data from a higher timeframe to plot simultaneous bullish and bearish momentum vectors on the current chart.

Indicator

MTF_i_Trend

Indicator

MTF_I_XO_A_H

Indicator

MTF_Juice

Indicator

MTF_Keltner_ATR_Bands

MTF_MA in Colorv3 refresh
Indicator

MTF_MA in Colorv3 refresh

iMA

This indicator projects higher timeframe moving averages onto the current chart, dynamically shifting colors to visualize momentum direction.

MTF_MA in Colorv3
Indicator

MTF_MA in Colorv3

iMA

This indicator calculates a multi-timeframe moving average, allowing selection of different MA types and applied prices, and color-codes the line based on the MA's direction.

MTF_MA-4H
Indicator

MTF_MA-4H

iMA

This indicator projects moving averages from a higher temporal resolution onto the current chart by synchronizing historical bar indices across disparate timeframes.

MTF_MA-4H_v1
Indicator

MTF_MA-4H_v1

iMA

This indicator projects moving averages from a higher timeframe onto the current chart to visualize long-term trends regardless of the active period.

MTF_MA
Indicator

MTF_MA

iMA

This indicator projects a smoothed moving average from a higher timeframe onto the current chart to identify broader market momentum.

Indicator

MTF_MACD

Indicator

MTF_MACD_4x1v3M

iMACD
Indicator

MTF_MACD_alpha

MTF_MACD_Bars
Indicator

MTF_MACD_Bars

iMACD

This indicator visualizes bullish and bearish momentum shifts by comparing the MACD Main line against its Signal line across various synchronized timeframes.

MTF_MACD_Bars_v1
Indicator

MTF_MACD_Bars_v1

iMACD

This indicator visualizes bullish and bearish momentum signals by analyzing the positional relationship between MACD Main and Signal lines across higher timeframes relative to the zero equilibrium.

MTF_MACD_HOH_v3M
Indicator

MTF_MACD_HOH_v3M

This indicator captures and synchronizes MACD data from higher timeframes while utilizing an adaptive scaling algorithm to normalize visual output across varying price volatility.

Indicator

MTF_MACD_inColor

iMACD
Indicator

MTF_MACD_inColor_001

iMACD
Indicator

MTF_MACD_inColor_002

iMACD

This indicator calculates and displays a multi-timeframe MACD, highlighting bullish and bearish divergences through a two-color histogram representation in a separate window.

Indicator

MTF_MACD_inColor_Alert

iMACD
Indicator

MTF_MACD_inColor_v1

iMACD
Indicator

MTF_MACD_Line

MTF_MACD_OsMA_L
Indicator

MTF_MACD_OsMA_L

This indicator synchronizes and projects MACD momentum values and smoothed moving average deviations from a higher timeframe onto the current chart for holistic trend analysis.

MTF_MACD_sBar_4Cm
Indicator

MTF_MACD_sBar_4Cm

iMACD

This indicator identifies bullish and bearish momentum by mapping high-level MACD main line positions against signal line crossovers from a secondary timeframe onto the current chart.

Indicator

MTF_MACD_ZeroLag_zlagmacd_line

MTF_MAChnl810_Env
Indicator

MTF_MAChnl810_Env

iMA

This indicator plots multi-timeframe moving average channel envelopes using specified moving average parameters and deviation on the current chart.

MTF_MAChnl810_Env_v1
Indicator

MTF_MAChnl810_Env_v1

iMA

This indicator calculates and projects dual moving average envelopes across different timeframes by applying independent percentage deviations to upper and lower price boundaries.

Indicator

MTF_MAMy3

Indicator

MTF_MAMy3_001

Indicator

MTF_MAMy3_v1

MTF_MARSI_v0.10
Indicator

MTF_MARSI_v0.10

iMAOnArrayiRSI

This indicator synchronizes and displays smoothed Relative Strength Index values across six concurrent timeframes to identify multi-layered momentum trends.

MTF_MARSI_v0.10_001
Indicator

MTF_MARSI_v0.10_001

iMAOnArrayiRSI

This indicator synchronizes and displays real-time Relative Strength Index values and their moving average smoothed counterparts across six distinct timeframes simultaneously on a single dashboard.

MTF_MARSI_v0.20
Indicator

MTF_MARSI_v0.20

iMAOnArrayiRSI

This indicator synchronizes Relative Strength Index (RSI) data across six distinct timeframes into a single visual dashboard, applying moving average smoothing to identify momentum trends.

MTF_MARSI_v0.20_001
Indicator

MTF_MARSI_v0.20_001

iMAOnArrayiRSI

This indicator synchronizes and visualizes Relative Strength Index data across six concurrent timeframes (M1 to H4) using smoothed moving averages to identify cross- khung momentum.

MTF_MARSI_v0.20_v1
Indicator

MTF_MARSI_v0.20_v1

iMAOnArrayiRSI

This indicator synchronizes and overlays smoothed Relative Strength Index (RSI) values across six distinct timeframes simultaneously to visualize multi-layered momentum shifts and trend exhaustion.

MTF_MA_001
Indicator

MTF_MA_001

iMAiMAOnArray

This indicator identifies directional momentum by calculating a smoothed moving average derived from multi-timeframe data to isolate trend shifts.