MurrayMath_v1
Download script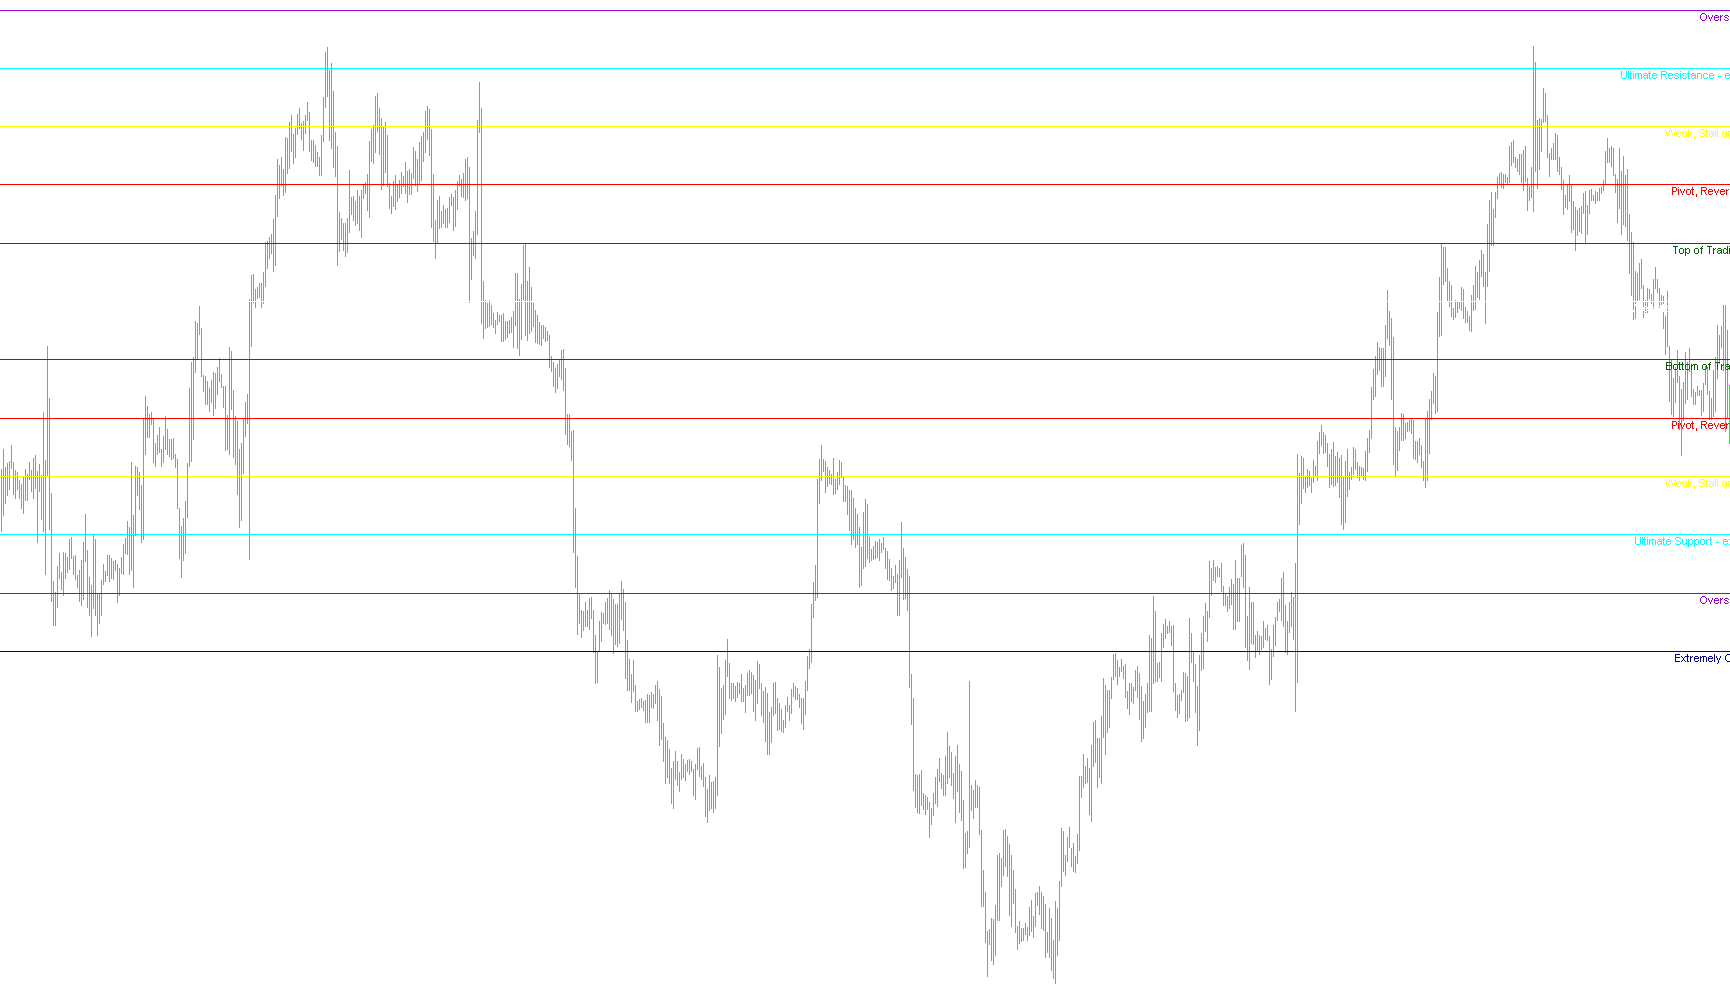
This script is designed to provide traders with a comprehensive visual framework for identifying significant price levels, support zones, and resistance areas using an algorithmic approach. Instead of simply trailing the current price, it analyzes historical data to construct a structured "map" of the market.
Core Methodology: Fractal Range Analysis
The logic begins by identifying the highest and lowest price points within a specific lookback period (defined by the user). Once these boundaries are established, the script calculates the total range of price movement. It then applies a multi-layered mathematical process to "fit" the current price action into a standardized scale.
By calculating the relationship between the current volatility and historical extremes, the script determines the most appropriate "octave" or magnitude for the current market cycle. This allows the tool to remain relevant whether the market is moving in small increments or large, volatile swings.
Dynamic Level Calculation
The script employs a series of complex conditional checks to pinpoint specific "Pivot Points." It looks for high-probability areas where price action is likely to stall, react, or reverse. These are categorized into several distinct zones:
- Extreme Zones: Identifies areas that are significantly overbought or oversold (Overshoot).
- Support & Resistance: Highlights major pivotal points where the price has historically struggled to break through.
- Trading Range Boundaries: Defines the "floor" and "ceiling" of the current trading range, helping traders identify when the market is reaching its limits.
- Transition Zones: Marks areas where the price might become "weak," indicating a potential stall or shift in momentum.
Visual Representation
The output of this logic is a series of 13 horizontal lines displayed directly on the chart. Each line represents a different mathematical tier:
- Color Coding: The script assigns specific colors to different zones (e.g., Red for major pivots, Green for support/resistance, and various shades for oversold or overbought conditions) to help with quick visual identification.
- Dynamic Labeling: Each line is accompanied by a text label that describes the nature of that level (e.g., "Ultimate Support," "Top of Trading Range," or "Pivot, Reverse").
- Real-Time Adaptation: The script automatically recalculates these levels as new price data arrives, shifting the lines to reflect the evolving market structure while maintaining the proportional spacing between the 13 key levels.
Practical Application for Users
For a non-technical user, this tool acts as a "grid" of significance. Rather than guessing where a support or resistance level might be, the script provides a pre-calculated map. Traders can use these lines to identify high-probability entry and exit points, observe when the price is entering "Premium" or "Discount" zones, and react to signals of market exhaustion based on the specific labels provided for each tier.
//+------------------------------------------------------------------+
//|                                            Murrey_Math_MT_VG.mq4 |
//|                      Copyright © 2004, MetaQuotes Software Corp. |
//|                                        http://www.metaquotes.net |
//+------------------------------------------------------------------+
#property copyright "Vladislav Goshkov (VG)."
#property link      "4vg@mail.ru"


#property indicator_chart_window


extern int P = 64;
extern int StepBack = 0;


double  dmml = 0,
        dvtl = 0,
        sum  = 0,
        v1 = 0,
        v2 = 0,
        mn = 0,
        mx = 0,
        x1 = 0,
        x2 = 0,
        x3 = 0,
        x4 = 0,
        x5 = 0,
        x6 = 0,
        y1 = 0,
        y2 = 0,
        y3 = 0,
        y4 = 0,
        y5 = 0,
        y6 = 0,
        octave = 0,
        fractal = 0,
        range   = 0,
        finalH  = 0,
        finalL  = 0,
        mml[13];


string  ln_txt[13],
        buff_str = "";


int
        bn_v1   = 0,
        bn_v2   = 0,
        OctLinesCnt = 13,
        mml_thk = 8,
        mml_clr[13],
        mml_shft = 3,
        nTime = 0,
        CurPeriod = 0,
        nDigits = 0,
        i = 0;


//+------------------------------------------------------------------+
//| Custom indicator initialization function                         |
//+------------------------------------------------------------------+
int init() {
//---- indicators


   ln_txt[0]  = "Extremely Overshoot";// "extremely overshoot [-2/8]";// [-2/8]
   ln_txt[1]  = "Overshoot";// "overshoot [-1/8]";// [-1/8]
   ln_txt[2]  = "Ultimate Support - extremely oversold";// "Ultimate Support - extremely oversold [0/8]";// [0/8]
   ln_txt[3]  = "Weak, Stall and Reverse";// "Weak, Stall and Reverse - [1/8]";// [1/8]
   ln_txt[4]  = "Pivot, Reverse - major";// "Pivot, Reverse - major [2/8]";// [2/8]
   ln_txt[5]  = "Bottom of Trading Range";// "Bottom of Trading Range - [3/8], if 10-12 bars then 40% Time. BUY Premium Zone";//[3/8]
   ln_txt[6]  = "Major Support/Resistance Pivotal Point-Best New BUY or SELL level";// "Major Support/Resistance Pivotal Point [4/8]- Best New BUY or SELL level";// [4/8]
   ln_txt[7]  = "Top of Trading Range";// "Top of Trading Range - [5/8], if 10-12 bars then 40% Time. SELL Premium Zone";//[5/8]
   ln_txt[8]  = "Pivot, Reverse - major";// "Pivot, Reverse - major [6/8]";// [6/8]
   ln_txt[9]  = "Weak, Stall and Reverse";// "Weak, Stall and Reverse - [7/8]";// [7/8]
   ln_txt[10] = "Ultimate Resistance - extremely overbought";// "Ultimate Resistance - extremely overbought [8/8]";// [8/8]
   ln_txt[11] = "Overshoot";// "overshoot [+1/8]";// [+1/8]
   ln_txt[12] = "Extremely Overshoot";// "extremely overshoot [+2/8]";// [+2/8]


   mml_shft = 3;
   mml_thk  = 3;


   mml_clr[0]  = DarkBlue;    // [-2]/8
   mml_clr[1]  = DarkViolet;  // [-1]/8
   mml_clr[2]  = Aqua;        //  [0]/8
   mml_clr[3]  = Yellow;      //  [1]/8
   mml_clr[4]  = Red;         //  [2]/8
   mml_clr[5]  = DarkGreen;   //  [3]/8
   mml_clr[6]  = White;       //  [4]/8
   mml_clr[7]  = DarkGreen;   //  [5]/8
   mml_clr[8]  = Red;         //  [6]/8
   mml_clr[9]  = Yellow;      //  [7]/8
   mml_clr[10] = Aqua;        //  [8]/8
   mml_clr[11] = DarkViolet;  // [+1]/8
   mml_clr[12] = DarkBlue;    // [+2]/8
   return(0);
  }


//+------------------------------------------------------------------+
//| Custor indicator deinitialization function                       |
//+------------------------------------------------------------------+
int deinit() {

Comment(" ");
for(i=0;i<OctLinesCnt;i++) {
    buff_str = "mml"+i;
    ObjectDelete(buff_str);
    buff_str = "mml_txt"+i;
    ObjectDelete(buff_str);
    }

   return(0);
  }
//+------------------------------------------------------------------+
//| Custom indicator iteration function                              |
//+------------------------------------------------------------------+

int start() {


if( (nTime != Time[0]) || (CurPeriod != Period()) ) {


  //price
   bn_v1 = Lowest(NULL,0,MODE_LOW,P+StepBack,0);
   bn_v2 = Highest(NULL,0,MODE_HIGH,P+StepBack,0);


   v1 = Low[bn_v1];
   v2 = High[bn_v2];


//determine fractal.....
   if( v2<=250000 && v2>25000 )
   fractal=100000;
   else
     if( v2<=25000 && v2>2500 )
     fractal=10000;
     else
       if( v2<=2500 && v2>250 )
       fractal=1000;
       else
         if( v2<=250 && v2>25 )
         fractal=100;
         else
           if( v2<=25 && v2>12.5 )
           fractal=12.5;
           else
             if( v2<=12.5 && v2>6.25)
             fractal=12.5;
             else
               if( v2<=6.25 && v2>3.125 )
               fractal=6.25;
               else
                 if( v2<=3.125 && v2>1.5625 )
                 fractal=3.125;
                 else
                   if( v2<=1.5625 && v2>0.390625 )
                   fractal=1.5625;
                   else
                     if( v2<=0.390625 && v2>0)
                     fractal=0.1953125;


   range=(v2-v1);
   sum=MathFloor(MathLog(fractal/range)/MathLog(2));
   octave=fractal*(MathPow(0.5,sum));
   mn=MathFloor(v1/octave)*octave;
   if( (mn+octave)>v2 )
   mx=mn+octave;
   else
     mx=mn+(2*octave);


// calculating xx
//x2
    if( (v1>=(3*(mx-mn)/16+mn)) && (v2<=(9*(mx-mn)/16+mn)) )
    x2=mn+(mx-mn)/2;
    else x2=0;
//x1
    if( (v1>=(mn-(mx-mn)/8))&& (v2<=(5*(mx-mn)/8+mn)) && (x2==0) )
    x1=mn+(mx-mn)/2;
    else x1=0;


//x4
    if( (v1>=(mn+7*(mx-mn)/16))&& (v2<=(13*(mx-mn)/16+mn)) )
    x4=mn+3*(mx-mn)/4;
    else x4=0;


//x5
    if( (v1>=(mn+3*(mx-mn)/8))&& (v2<=(9*(mx-mn)/8+mn))&& (x4==0) )
    x5=mx;
    else  x5=0;


//x3
    if( (v1>=(mn+(mx-mn)/8))&& (v2<=(7*(mx-mn)/8+mn))&& (x1==0) && (x2==0) && (x4==0) && (x5==0) )
    x3=mn+3*(mx-mn)/4;
    else x3=0;


//x6
    if( (x1+x2+x3+x4+x5) ==0 )
    x6=mx;
    else x6=0;


     finalH = x1+x2+x3+x4+x5+x6;
// calculating yy
//y1
    if( x1>0 )
    y1=mn;
    else y1=0;


//y2
    if( x2>0 )
    y2=mn+(mx-mn)/4;
    else y2=0;


//y3
    if( x3>0 )
    y3=mn+(mx-mn)/4;
    else y3=0;


//y4
    if( x4>0 )
    y4=mn+(mx-mn)/2;
    else y4=0;


//y5
    if( x5>0 )
    y5=mn+(mx-mn)/2;
    else y5=0;


//y6
    if( (finalH>0) && ((y1+y2+y3+y4+y5)==0) )
    y6=mn;
    else y6=0;


    finalL = y1+y2+y3+y4+y5+y6;


    for( i=0; i<OctLinesCnt; i++) {
         mml[i] = 0;
         }


   dmml = (finalH-finalL)/8;


   mml[0] =(finalL-dmml*2); //-2/8
   for( i=1; i<OctLinesCnt; i++) {
        mml[i] = mml[i-1] + dmml;
        }
   for( i=0; i<OctLinesCnt; i++ ){
        buff_str = "mml"+i;
        if(ObjectFind(buff_str) == -1) {
           ObjectCreate(buff_str, OBJ_HLINE, 0, Time[0], mml[i]);
           ObjectSet(buff_str, OBJPROP_STYLE, STYLE_SOLID);
           ObjectSet(buff_str, OBJPROP_COLOR, mml_clr[i]);
           ObjectMove(buff_str, 0, Time[0],  mml[i]);
           }
        else {
           ObjectMove(buff_str, 0, Time[0],  mml[i]);
           }


        buff_str = "mml_txt"+i;
        if(ObjectFind(buff_str) == -1) {
           ObjectCreate(buff_str, OBJ_TEXT, 0, Time[mml_shft], mml_shft);
           ObjectSetText(buff_str, ln_txt[i], 8, "Arial", mml_clr[i]);
           ObjectMove(buff_str, 0, Time[mml_shft],  mml[i]);
           }
        else {
           ObjectMove(buff_str, 0, Time[mml_shft],  mml[i]);
           }
        } // for( i=1; i<=OctLinesCnt; i++ ){


   nTime    = Time[0];
   CurPeriod= Period();


   }


//---- End Of Program
  return(0);
  }
//+------------------------------------------------------------------+
Comments