MurrayMath
Download script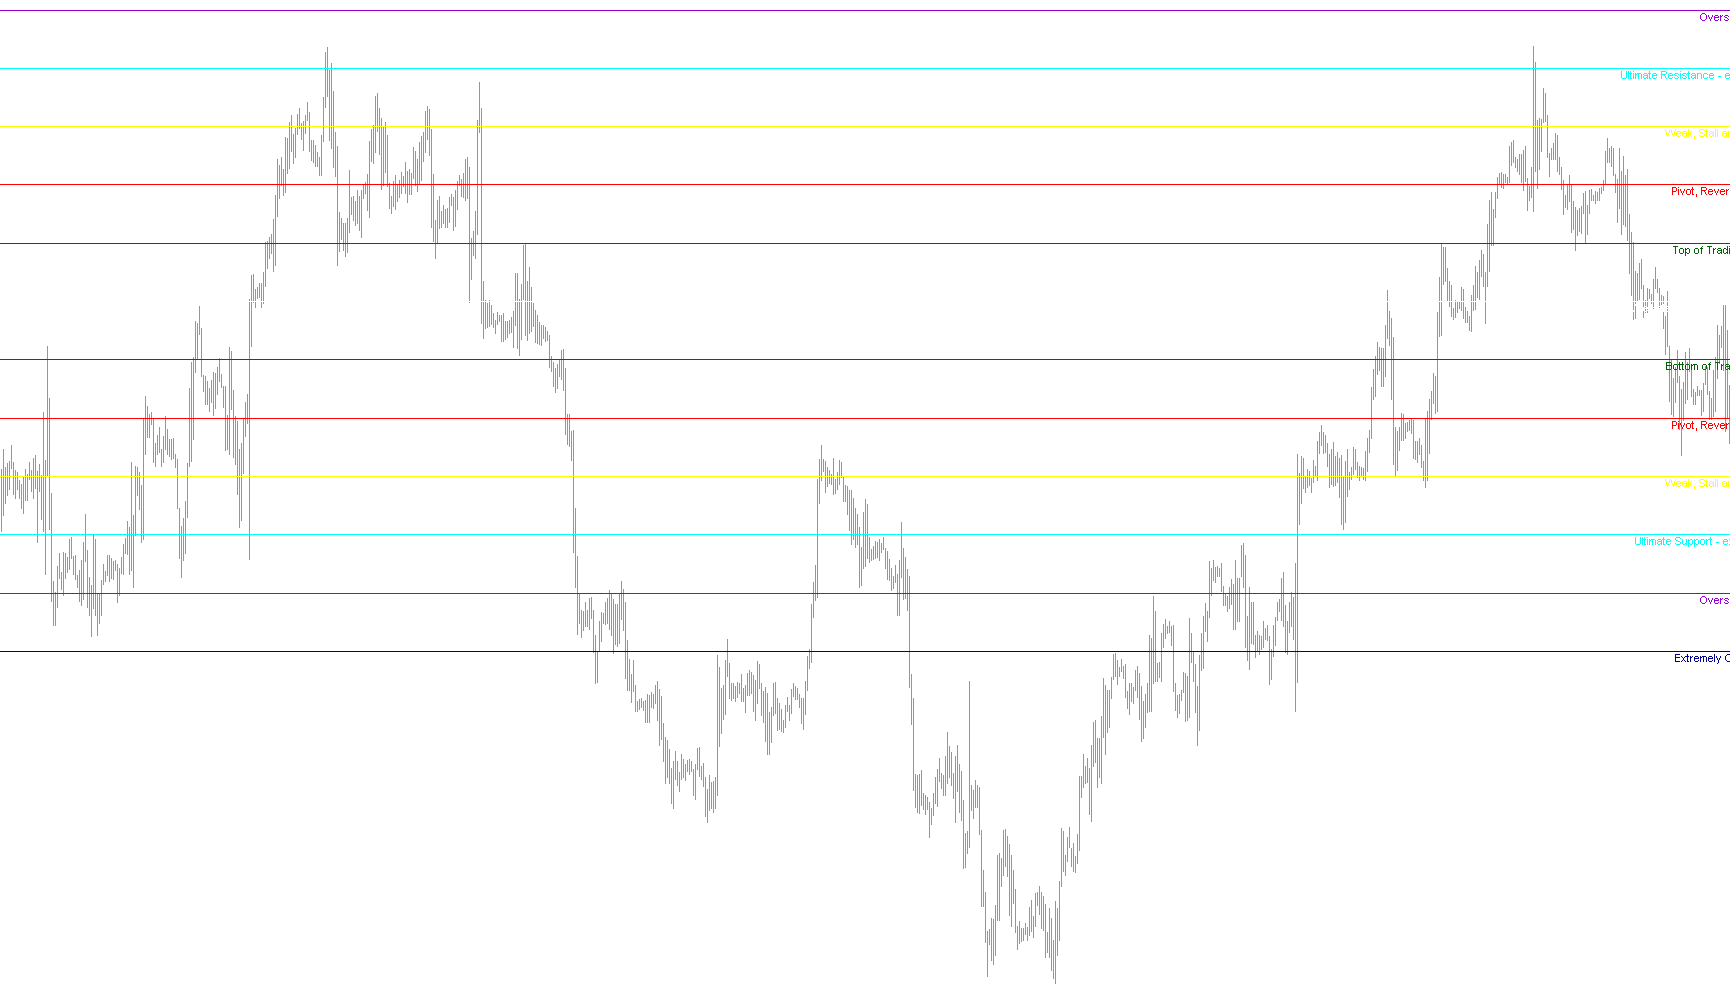
This script is designed to provide traders with a comprehensive visual map of market price boundaries by identifying significant support and resistance levels. It uses a mathematical approach called "Murrey Math," which focuses on dividing the price action into predictable geometric zones based on the highest and lowest prices reached over a specific period.
How the Logic Works
1. Establishing the Range The tool begins by scanning a user-defined lookback period (determined by the "P" setting) to identify the absolute highest and lowest prices. These two points define the current "trading range."
2. Fractal Scaling and Octaves Instead of just looking at the price as a flat number, the script applies a fractal scaling logic. It calculates how the current price range fits into larger mathematical patterns (known as octaves). This helps the tool distinguish between minor price fluctuations and major structural shifts in the market.
3. Identifying Pivot Points The core of the logic involves searching for specific "pivot points" within the trading range. The script checks if the current price action satisfies various mathematical conditions to determine if a certain level is a significant point of interest. It specifically looks for:
- Major pivots and reversals.
- Points where the price "stalls" or shows weakness.
- The ultimate boundaries (the absolute top and bottom) of the current movement.
4. Generating the 8-Level Grid Once the key pivot points are identified, the script calculates a primary "difference value." It then uses this value to construct a grid of 13 horizontal lines across your chart. These levels are organized into a hierarchy:
- Extreme Zones: The outermost lines represent "Extremely Overshot" or "Extremely Overbought" areas, indicating prices that are significantly outside the normal range.
- Support and Resistance: The middle lines highlight "Major Support/Resistance," "Top of Trading Range," and "Bottom of Trading Range." These are the levels where price is most likely to react or bounce.
- Transition Zones: The inner lines identify "Weak" areas, "Stalls," and "Reversals," providing clues on whether the current momentum is fading.
Visual Presentation
The script automatically draws these horizontal lines and labels them on your chart with distinct colors. Each color corresponds to a specific market state:
- Cool Colors (Blues/Purples): Generally represent oversold or bottom-heavy zones.
- Warm Colors (Reds/Yellows): Generally represent overbought or top-heavy zones.
- Green and White: Often represent the "heart" of the trading range or major pivotal equilibrium points.
By providing this structured grid, the logic allows a trader to see at a glance where the market is currently positioned relative to historical highs, lows, and significant psychological boundaries.
/*-----------------------------+
|			       |
| Shared by www.Aptrafx.com    |
|			       |
+------------------------------*/

//+------------------------------------------------------------------+
//|                                            Murrey_Math_MT_VG.mq4 |
//|                      Copyright © 2004, MetaQuotes Software Corp. |
//|                                        http://www.metaquotes.net |
//+------------------------------------------------------------------+
#property copyright "Vladislav Goshkov (VG)."
#property link      "4vg@mail.ru"


#property indicator_chart_window


extern int P = 64;
extern int StepBack = 0;


double  dmml = 0,
        dvtl = 0,
        sum  = 0,
        v1 = 0,
        v2 = 0,
        mn = 0,
        mx = 0,
        x1 = 0,
        x2 = 0,
        x3 = 0,
        x4 = 0,
        x5 = 0,
        x6 = 0,
        y1 = 0,
        y2 = 0,
        y3 = 0,
        y4 = 0,
        y5 = 0,
        y6 = 0,
        octave = 0,
        fractal = 0,
        range   = 0,
        finalH  = 0,
        finalL  = 0,
        mml[13];


string  ln_txt[13],
        buff_str = "";


int
        bn_v1   = 0,
        bn_v2   = 0,
        OctLinesCnt = 13,
        mml_thk = 8,
        mml_clr[13],
        mml_shft = 3,
        nTime = 0,
        CurPeriod = 0,
        nDigits = 0,
        i = 0;


//+------------------------------------------------------------------+
//| Custom indicator initialization function                         |
//+------------------------------------------------------------------+
int init() {
//---- indicators


   ln_txt[0]  = "Extremely Overshoot";// "extremely overshoot [-2/8]";// [-2/8]
   ln_txt[1]  = "Overshoot";// "overshoot [-1/8]";// [-1/8]
   ln_txt[2]  = "Ultimate Support - extremely oversold";// "Ultimate Support - extremely oversold [0/8]";// [0/8]
   ln_txt[3]  = "Weak, Stall and Reverse";// "Weak, Stall and Reverse - [1/8]";// [1/8]
   ln_txt[4]  = "Pivot, Reverse - major";// "Pivot, Reverse - major [2/8]";// [2/8]
   ln_txt[5]  = "Bottom of Trading Range";// "Bottom of Trading Range - [3/8], if 10-12 bars then 40% Time. BUY Premium Zone";//[3/8]
   ln_txt[6]  = "Major Support/Resistance Pivotal Point-Best New BUY or SELL level";// "Major Support/Resistance Pivotal Point [4/8]- Best New BUY or SELL level";// [4/8]
   ln_txt[7]  = "Top of Trading Range";// "Top of Trading Range - [5/8], if 10-12 bars then 40% Time. SELL Premium Zone";//[5/8]
   ln_txt[8]  = "Pivot, Reverse - major";// "Pivot, Reverse - major [6/8]";// [6/8]
   ln_txt[9]  = "Weak, Stall and Reverse";// "Weak, Stall and Reverse - [7/8]";// [7/8]
   ln_txt[10] = "Ultimate Resistance - extremely overbought";// "Ultimate Resistance - extremely overbought [8/8]";// [8/8]
   ln_txt[11] = "Overshoot";// "overshoot [+1/8]";// [+1/8]
   ln_txt[12] = "Extremely Overshoot";// "extremely overshoot [+2/8]";// [+2/8]


   mml_shft = 3;
   mml_thk  = 3;


   mml_clr[0]  = DarkBlue;    // [-2]/8
   mml_clr[1]  = DarkViolet;  // [-1]/8
   mml_clr[2]  = Aqua;        //  [0]/8
   mml_clr[3]  = Yellow;      //  [1]/8
   mml_clr[4]  = Red;         //  [2]/8
   mml_clr[5]  = DarkGreen;   //  [3]/8
   mml_clr[6]  = White;       //  [4]/8
   mml_clr[7]  = DarkGreen;   //  [5]/8
   mml_clr[8]  = Red;         //  [6]/8
   mml_clr[9]  = Yellow;      //  [7]/8
   mml_clr[10] = Aqua;        //  [8]/8
   mml_clr[11] = DarkViolet;  // [+1]/8
   mml_clr[12] = DarkBlue;    // [+2]/8
   return(0);
  }


//+------------------------------------------------------------------+
//| Custor indicator deinitialization function                       |
//+------------------------------------------------------------------+
int deinit() {

Comment(" ");
for(i=0;i<OctLinesCnt;i++) {
    buff_str = "mml"+i;
    ObjectDelete(buff_str);
    buff_str = "mml_txt"+i;
    ObjectDelete(buff_str);
    }

   return(0);
  }
//+------------------------------------------------------------------+
//| Custom indicator iteration function                              |
//+------------------------------------------------------------------+

int start() {


if( (nTime != Time[0]) || (CurPeriod != Period()) ) {


  //price
   bn_v1 = Lowest(NULL,0,MODE_LOW,P+StepBack,0);
   bn_v2 = Highest(NULL,0,MODE_HIGH,P+StepBack,0);


   v1 = Low[bn_v1];
   v2 = High[bn_v2];


//determine fractal.....
   if( v2<=250000 && v2>25000 )
   fractal=100000;
   else
     if( v2<=25000 && v2>2500 )
     fractal=10000;
     else
       if( v2<=2500 && v2>250 )
       fractal=1000;
       else
         if( v2<=250 && v2>25 )
         fractal=100;
         else
           if( v2<=25 && v2>12.5 )
           fractal=12.5;
           else
             if( v2<=12.5 && v2>6.25)
             fractal=12.5;
             else
               if( v2<=6.25 && v2>3.125 )
               fractal=6.25;
               else
                 if( v2<=3.125 && v2>1.5625 )
                 fractal=3.125;
                 else
                   if( v2<=1.5625 && v2>0.390625 )
                   fractal=1.5625;
                   else
                     if( v2<=0.390625 && v2>0)
                     fractal=0.1953125;


   range=(v2-v1);
   sum=MathFloor(MathLog(fractal/range)/MathLog(2));
   octave=fractal*(MathPow(0.5,sum));
   mn=MathFloor(v1/octave)*octave;
   if( (mn+octave)>v2 )
   mx=mn+octave;
   else
     mx=mn+(2*octave);


// calculating xx
//x2
    if( (v1>=(3*(mx-mn)/16+mn)) && (v2<=(9*(mx-mn)/16+mn)) )
    x2=mn+(mx-mn)/2;
    else x2=0;
//x1
    if( (v1>=(mn-(mx-mn)/8))&& (v2<=(5*(mx-mn)/8+mn)) && (x2==0) )
    x1=mn+(mx-mn)/2;
    else x1=0;


//x4
    if( (v1>=(mn+7*(mx-mn)/16))&& (v2<=(13*(mx-mn)/16+mn)) )
    x4=mn+3*(mx-mn)/4;
    else x4=0;


//x5
    if( (v1>=(mn+3*(mx-mn)/8))&& (v2<=(9*(mx-mn)/8+mn))&& (x4==0) )
    x5=mx;
    else  x5=0;


//x3
    if( (v1>=(mn+(mx-mn)/8))&& (v2<=(7*(mx-mn)/8+mn))&& (x1==0) && (x2==0) && (x4==0) && (x5==0) )
    x3=mn+3*(mx-mn)/4;
    else x3=0;


//x6
    if( (x1+x2+x3+x4+x5) ==0 )
    x6=mx;
    else x6=0;


     finalH = x1+x2+x3+x4+x5+x6;
// calculating yy
//y1
    if( x1>0 )
    y1=mn;
    else y1=0;


//y2
    if( x2>0 )
    y2=mn+(mx-mn)/4;
    else y2=0;


//y3
    if( x3>0 )
    y3=mn+(mx-mn)/4;
    else y3=0;


//y4
    if( x4>0 )
    y4=mn+(mx-mn)/2;
    else y4=0;


//y5
    if( x5>0 )
    y5=mn+(mx-mn)/2;
    else y5=0;


//y6
    if( (finalH>0) && ((y1+y2+y3+y4+y5)==0) )
    y6=mn;
    else y6=0;


    finalL = y1+y2+y3+y4+y5+y6;


    for( i=0; i<OctLinesCnt; i++) {
         mml[i] = 0;
         }


   dmml = (finalH-finalL)/8;


   mml[0] =(finalL-dmml*2); //-2/8
   for( i=1; i<OctLinesCnt; i++) {
        mml[i] = mml[i-1] + dmml;
        }
   for( i=0; i<OctLinesCnt; i++ ){
        buff_str = "mml"+i;
        if(ObjectFind(buff_str) == -1) {
           ObjectCreate(buff_str, OBJ_HLINE, 0, Time[0], mml[i]);
           ObjectSet(buff_str, OBJPROP_STYLE, STYLE_SOLID);
           ObjectSet(buff_str, OBJPROP_COLOR, mml_clr[i]);
           ObjectMove(buff_str, 0, Time[0],  mml[i]);
           }
        else {
           ObjectMove(buff_str, 0, Time[0],  mml[i]);
           }


        buff_str = "mml_txt"+i;
        if(ObjectFind(buff_str) == -1) {
           ObjectCreate(buff_str, OBJ_TEXT, 0, Time[mml_shft], mml_shft);
           ObjectSetText(buff_str, ln_txt[i], 8, "Arial", mml_clr[i]);
           ObjectMove(buff_str, 0, Time[mml_shft],  mml[i]);
           }
        else {
           ObjectMove(buff_str, 0, Time[mml_shft],  mml[i]);
           }
        } // for( i=1; i<=OctLinesCnt; i++ ){


   nTime    = Time[0];
   CurPeriod= Period();


   }


//---- End Of Program
  return(0);
  }
//+------------------------------------------------------------------+
Comments