Multi_Indic_BR
Download script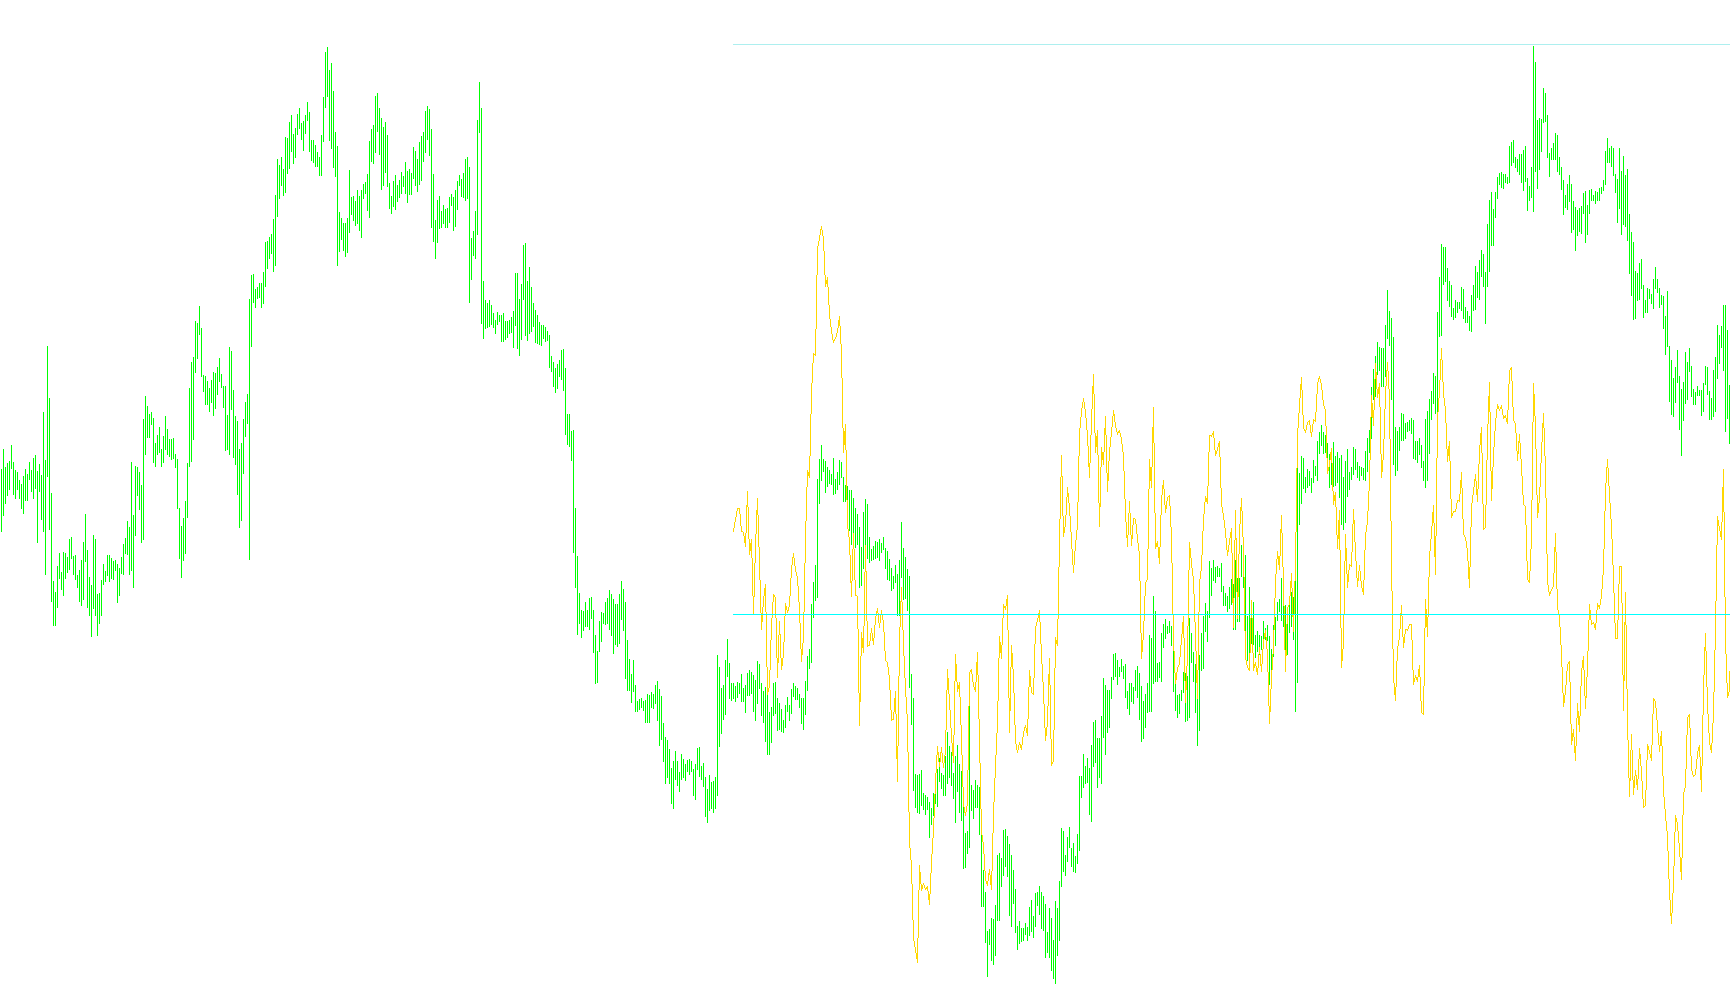
This custom technical indicator is designed to provide a comprehensive, multi-layered view of market momentum and price action by consolidating five distinct financial metrics into a single visual display. Instead of requiring the trader to monitor multiple separate windows, this script aggregates different data types—ranging from volatility to strength—into a unified chart overlay.
Core Functionality
The primary logic of the script revolves around Data Aggregation. It pulls information from five specific technical indicators and calculates their values in real-time. Each indicator is processed with unique mathematical offsets to ensure they are displayed appropriately within the same visual space:
- Relative Strength Index (RSI) Adjustment: The script tracks the RSI but shifts its baseline by 50 units, helping to center the data for better visual symmetry.
- Commodity Channel Index (CCI): It captures the price's deviation from its statistical average to identify overbought or oversold conditions.
- Williams Percent Range (WPR) Adjustment: The script fetches WPR data and applies a 50-unit offset, allowing for a clearer comparison against other momentum values.
- Relative Vigor Index (RVI): This metric is scaled by a factor of 500, significantly expanding its range to make its movements visible alongside higher-magnitude data points.
- Custom Named Indicator: The script also integrates an additional custom data stream, ensuring that proprietary or specific market logic can be viewed simultaneously with the standard metrics.
Technical Behavior and Visualization
From a user experience perspective, the script handles several background tasks to ensure smooth performance:
- Dynamic Range Management: The indicator is designed to look back at a specific number of historical bars (defaulting to 500). This ensures that the chart remains clean and focuses on relevant recent price action while remaining capable of displaying enough history to identify trends.
- Buffer Management: It creates five distinct "buffers" or data paths. Each path corresponds to one of the indicators mentioned above, assigned unique colors (such as Yellow, Orange, Red, Violet, and Maroon) so that the user can easily distinguish between different market signals at a glance.
- Initialization Logic: When loaded, the script automatically prepares the chart by initializing the starting points of these five lines, ensuring there are no graphical errors or "broken" lines during the first few seconds of operation.
In summary, this tool acts as a centralized dashboard. It takes complex, disparate data from five different sources, normalizes their scales so they can be compared side-by-side, and draws them as distinct lines on a single sub-window for simplified technical analysis.
//+------------------------------------------------------------------+
//|                                      Multi_Indic_Blonde_Ruda.mq4 |
//|                      Copyright © 2010, MetaQuotes Software Corp. |
//|                                        http://www.metaquotes.net |
//+------------------------------------------------------------------+
#property copyright "Copyright © 2010, MetaQuotes Software Corp."
#property link      "http://www.metaquotes.net"

#property indicator_separate_window

#property indicator_buffers 5

#property indicator_color1 Yellow
#property indicator_color2 DarkOrange
#property indicator_color3 Red
#property indicator_color4 DarkViolet
#property indicator_color5 Maroon

extern int TimeFrame  =0;
extern int TimeFrame1 =0;
extern int TimeFrame2 =0;
extern int TimeFrame3 =0;
extern int TimeFrame4 =0;
extern int CountBars  =500;
extern int x_prd      =0;
//---- buffers
double Multi_Indic[];
double Multi_Indic1[];
double Multi_Indic2[];
double Multi_Indic3[];
double Multi_Indic4[];
string short_name;
//+------------------------------------------------------------------+
//| Custom indicator initialization function                         |
//+------------------------------------------------------------------+

int init() {

//---- name for DataWindow and indicator subwindow label
    short_name = "Multi_Indic_BR("+TimeFrame+")";
    IndicatorShortName(short_name);
    IndicatorBuffers(5);
    SetIndexBuffer(0,Multi_Indic);
    SetIndexStyle(0,DRAW_LINE,0,1);
    SetIndexBuffer(1,Multi_Indic1);
    SetIndexStyle(1,DRAW_LINE,0,1);
    SetIndexBuffer(2,Multi_Indic2);
    SetIndexStyle(2,DRAW_LINE,0,1);
    SetIndexBuffer(3,Multi_Indic3);
    SetIndexStyle(3,DRAW_LINE,0,1);
    SetIndexBuffer(4,Multi_Indic4);
    SetIndexStyle(4,DRAW_LINE,0,1);
//----
   return (0);
}
int deinit() {
   return (0);
}
//+------------------------------------------------------------------+
//| Skid                                                           |
//+------------------------------------------------------------------+
int start()
  {
   if (CountBars>=Bars) CountBars=Bars;
   SetIndexDrawBegin(0,Bars-CountBars);
   SetIndexDrawBegin(1,Bars-CountBars);
   SetIndexDrawBegin(2,Bars-CountBars);
   SetIndexDrawBegin(3,Bars-CountBars);
   SetIndexDrawBegin(4,Bars-CountBars);
   int i, ii,iii,iiii,iiiii ,counted_bars=IndicatorCounted();

   double t_prd;
//----
   if(Bars<=x_prd) return(0);
//---- initial zero
   if(counted_bars<x_prd)
   {
      for(i=1;i<=x_prd;i++) Multi_Indic[CountBars-i]=0.0;
      for(ii=1;ii<=x_prd;ii++) Multi_Indic1[CountBars-ii]=0.0;
      for(iii=1;iii<=x_prd;iii++) Multi_Indic2[CountBars-iii]=0.0;
      for(iiii=1;iiii<=x_prd;iiii++) Multi_Indic3[CountBars-iiii]=0.0;
      for(iiiii=1;iiiii<=x_prd;iiiii++) Multi_Indic4[CountBars-iiiii]=0.0;
   }
//----
   i=CountBars-x_prd-1;
   ii=CountBars-x_prd-1;
   iii=CountBars-x_prd-1;
   iiii=CountBars-x_prd-1;
   iiiii=CountBars-x_prd-1;

   t_prd=x_prd/2+1;

   while(i>=0)
   while(ii>=0)
   while(iii>=0)
   while(iiii>=0)
   while(iiiii>=0)
     {
     Multi_Indic[i]=((iCustom(NULL, 0, "I_RSI", 14, 0, 0, i)  ))-50 ;
     Multi_Indic1[ii]=((iCustom(NULL, 0, "I_CCI", 14, 0, 0, ii)  )) ;
     Multi_Indic2[iii]=((iCustom(NULL, 0, "I_WPR", 14, 0, 0, iii)  ))+50 ;
     Multi_Indic3[iiii]=((iCustom(NULL, 0, "I_RVI", 10, 0, 0, iiii)  ))*500 ;
     Multi_Indic4[iiiii]=((iCustom(NULL, 0, "Indicators_Name", 0, 0, 0, iiiii)  )) ;

      i--;
      ii--;
      iii--;
      iiii--;
      iiiii--;
     }

   return(0);
  }

//+------------------------------------------------------------------+
Comments