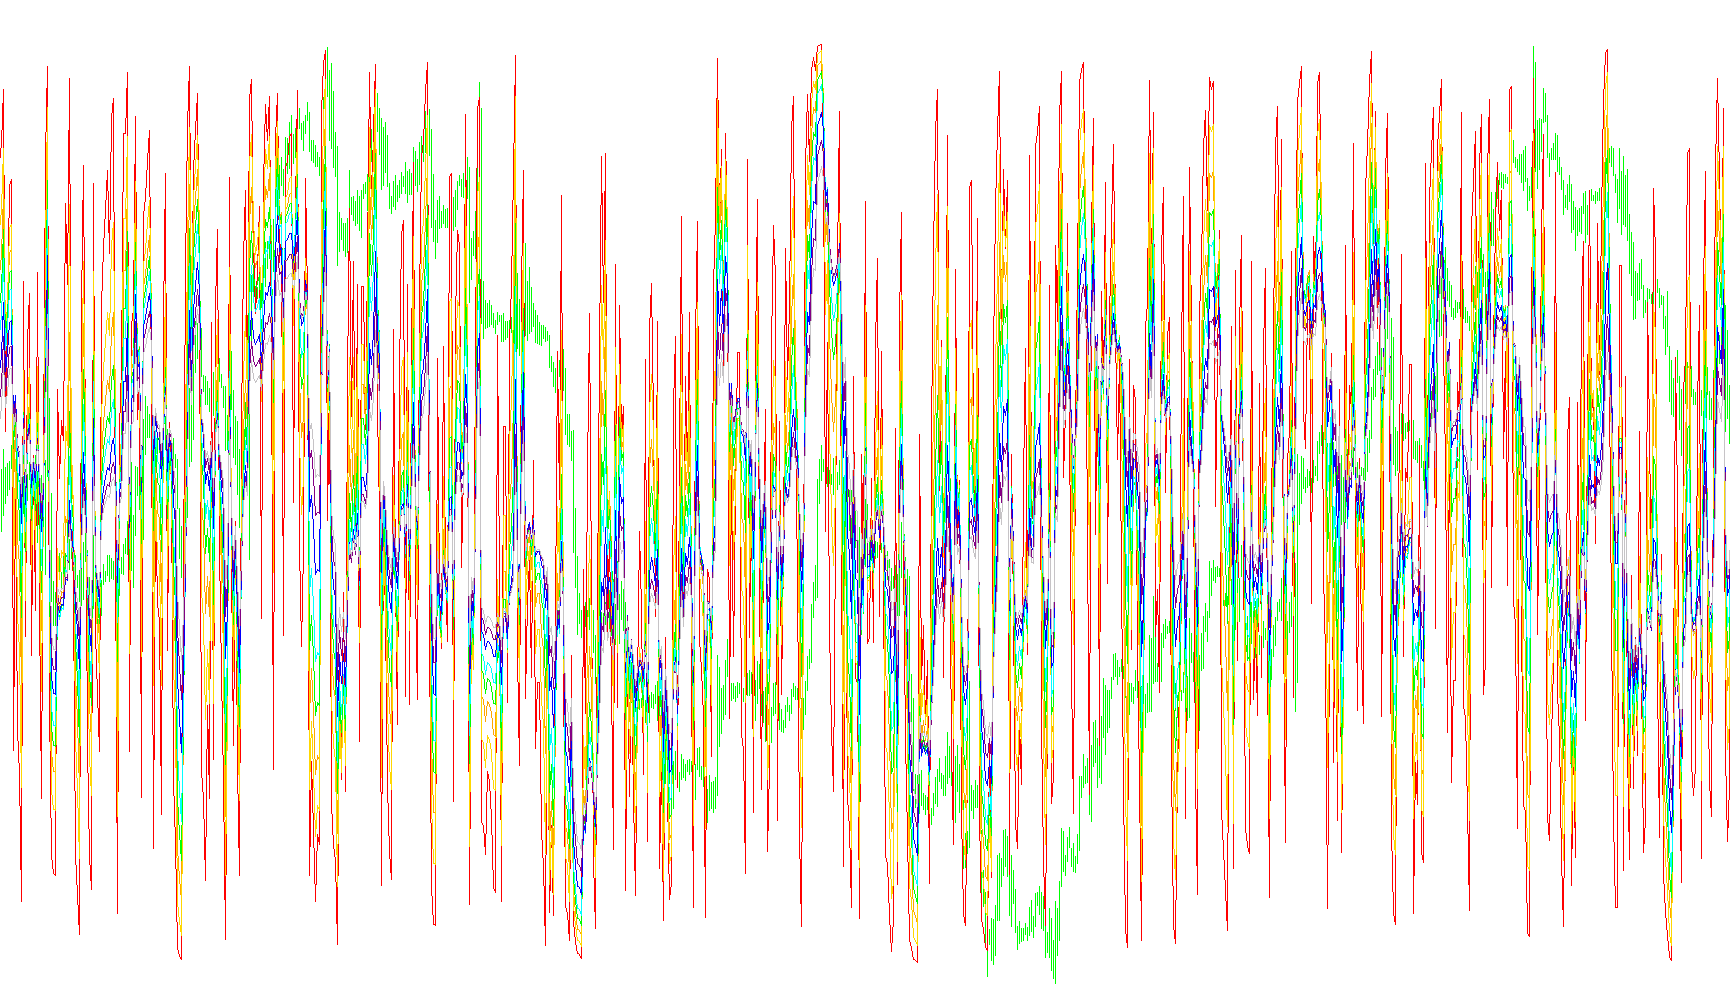
This tool is designed as a visual analysis indicator for the MetaTrader platform, specifically created to provide a comprehensive overview of market momentum. Rather than relying on a single perspective, it aggregates multiple layers of data into one clear view to help traders identify trends more effectively.
Core Logic and Functionality
The script operates by calculating eight different versions of the Relative Strength Index (RSI) simultaneously. The RSI is a standard technical tool used to measure the speed and change of price movements; however, using only one RSI can sometimes lead to a narrow view of the market. This indicator solves that by scanning the market across eight different "time windows" or sensitivities.
How it Works
- Multi-Layered Analysis: The script calculates eight unique RSI lines at once. Each line corresponds to a different period (ranging from very short-term movements to slightly longer ones). By displaying these together, you can see how the market is behaving across various timeframes in a single glance.
- Dynamic Data Inputs: You have the flexibility to choose which price data the indicator should prioritize—whether it should look at the "Close" price (the final price of a candle) or the "High/Low" extremes. This allows the tool to be customized based on your specific trading style.
- Visual Organization: Each of the eight calculations is assigned its own distinct color (such as Red, Orange, Gold, Lime, Aqua, Blue, Purple, and Silver). This color-coding makes it easy to distinguish between the different trend layers visually.
Trading Utility
The primary goal of this script is to provide a "consensus" view of the market. When these multiple lines move in harmony, it suggests a strong, synchronized trend. Conversely, when the lines diverge or cross each other significantly, it can indicate volatility or a potential shift in momentum. By viewing all eight layers at once, traders can better identify where the different trends align, potentially leading to more informed decision-making regarding market entries and exits.
//+------------------------------------------------------------------+
//|                                                Multi_RSI(AM).mq4 |
//|                                               Andrey Matvievskiy |
//|                                                                  |
//+------------------------------------------------------------------+
#property copyright "Andrey Matvievskiy"
#property link      ""

#property indicator_separate_window


#property indicator_buffers 8

#property indicator_minimum 0
#property indicator_maximum 100

//---- input parameters
extern int RSI_Period1 = 2;
extern int RSI_Period2 = 4;
extern int RSI_Period3 = 3;
extern int RSI_Period4 = 5;
extern int RSI_Period5 = 6;
extern int RSI_Period6 = 8;
extern int RSI_Period7 = 10;
extern int RSI_Period8 = 12;

extern int Price = 0; // Low/High 0, Close/Close 1


   double Buffer1[] ;
   double Buffer2[] ;
   double Buffer3[] ;
   double Buffer4[] ;
   double Buffer5[] ;
   double Buffer6[] ;
   double Buffer7[] ;
   double Buffer8[] ;
//+------------------------------------------------------------------+
//| Custom indicator initialization function                         |
//+------------------------------------------------------------------+
int init()
  {
   SetIndexStyle(0,DRAW_LINE,EMPTY,1,Red);
   SetIndexBuffer(0, Buffer1);

   SetIndexStyle(1,DRAW_LINE,EMPTY,1,Orange);
   SetIndexBuffer(1, Buffer2);

   SetIndexStyle(2,DRAW_LINE,EMPTY,1,Gold);
   SetIndexBuffer(2, Buffer3);

   SetIndexStyle(3,DRAW_LINE,EMPTY,1,Lime);
   SetIndexBuffer(3, Buffer4);

   SetIndexStyle(4,DRAW_LINE,EMPTY,1,Aqua);
   SetIndexBuffer(4, Buffer5);

   SetIndexStyle(5,DRAW_LINE,EMPTY,1,Blue);
   SetIndexBuffer(5, Buffer6);

   SetIndexStyle(6,DRAW_LINE,EMPTY,1,Purple);
   SetIndexBuffer(6, Buffer7);

   SetIndexStyle(7,DRAW_LINE,EMPTY,1,Silver);
   SetIndexBuffer(7, Buffer8);


   return(0);
  }
//+------------------------------------------------------------------+
//| Custom indicator deinitialization function                       |
//+------------------------------------------------------------------+
int deinit()
  {
//----

//----
   return(0);
  }
//+------------------------------------------------------------------+
//| Custom indicator iteration function                              |
//+------------------------------------------------------------------+
  int start()
 {
   int limit;
   int counted_bars=IndicatorCounted();

   if(counted_bars<0) return(-1);

   if(counted_bars>0) counted_bars--;
   limit=Bars-counted_bars;

   for(int i=limit; i>=0; i--)
  {

//----
    Buffer1[i] = iRSI (NULL,0,RSI_Period1,Price,i);
    Buffer2[i] = iRSI (NULL,0,RSI_Period2,Price,i);
    Buffer3[i] = iRSI (NULL,0,RSI_Period3,Price,i);
    Buffer4[i] = iRSI (NULL,0,RSI_Period4,Price,i);
    Buffer5[i] = iRSI (NULL,0,RSI_Period5,Price,i);
    Buffer6[i] = iRSI (NULL,0,RSI_Period6,Price,i);
    Buffer7[i] = iRSI (NULL,0,RSI_Period7,Price,i);
    Buffer8[i] = iRSI (NULL,0,RSI_Period8,Price,i);
  }

//----
   return(0);
  }
//+------------------------------------------------------------------+
Comments