MTF_AbsoluteStrength_v1
Download script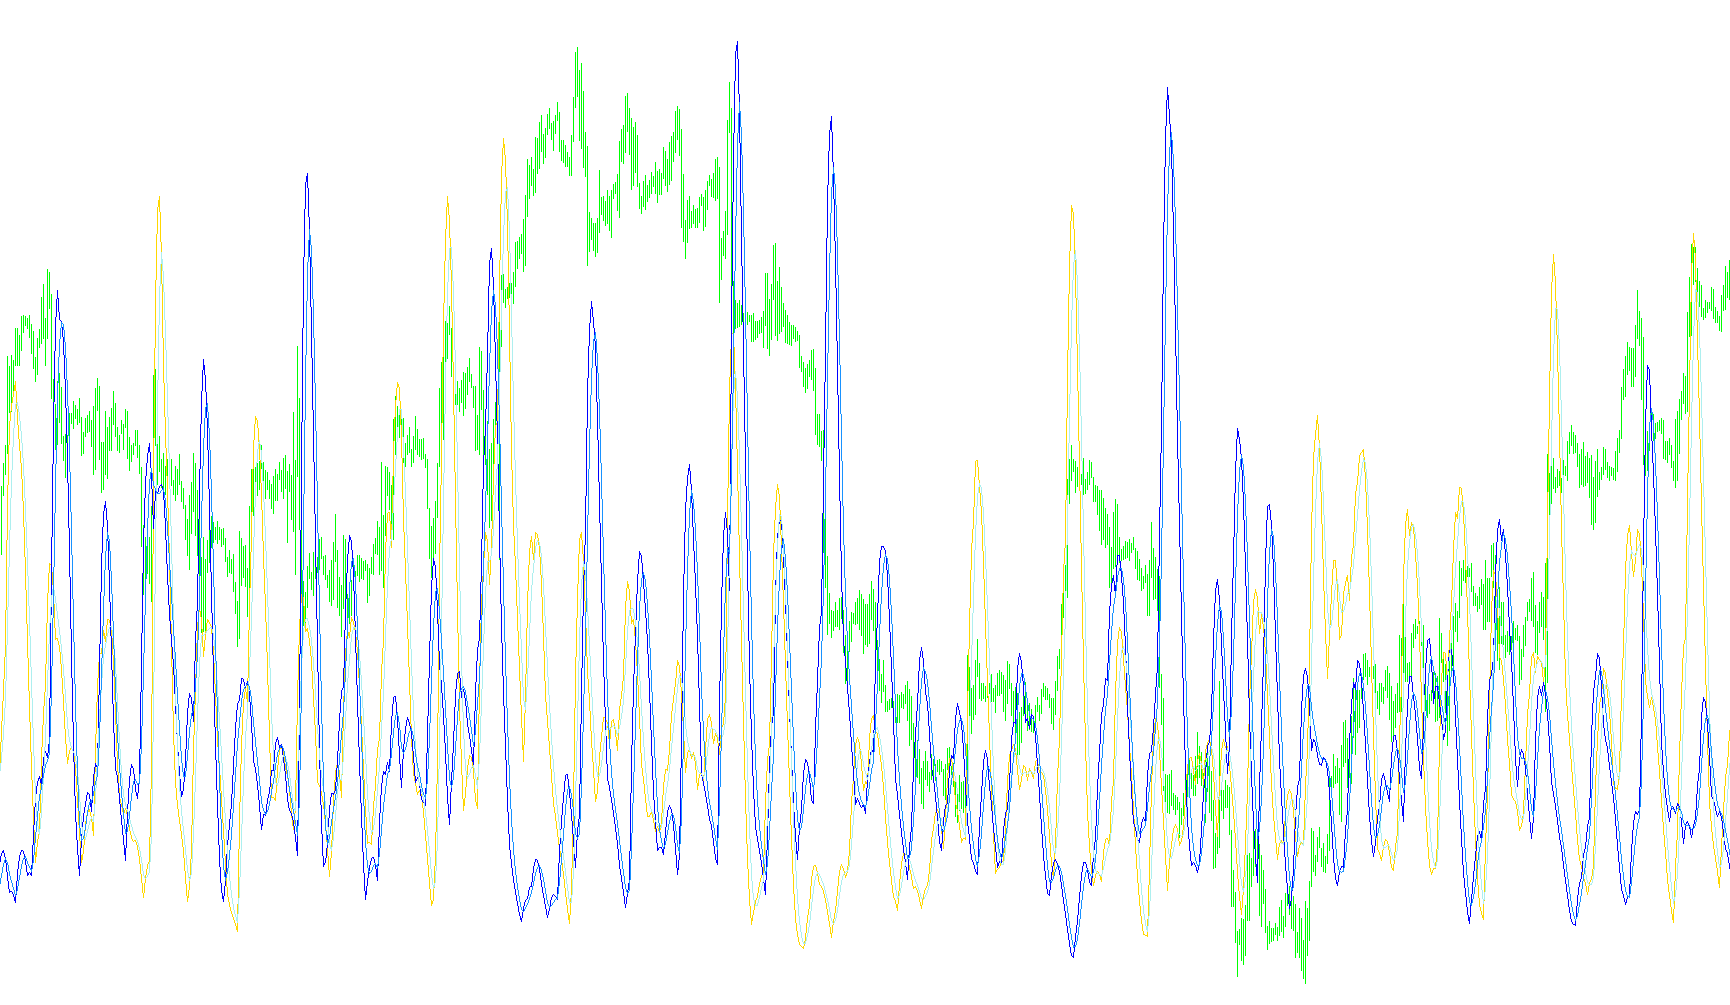
This script is designed as a multi-timeframe analytical tool for the MetaTrader platform. Its primary purpose is to measure and visualize the relative strength of "Bulls" (buyers) versus "Bears" (sellers) by pulling data from different time horizons onto your current chart.
Core Functionality
Multi-Timeframe Analysis The core logic allows the user to view market sentiment from a higher time frame (such as Daily or Weekly) while looking at a lower time frame (such as 15-minute or Hourly). This provides a "big picture" perspective, helping traders understand if the broader market trend supports their current short-term actions.
Dynamic Strength Measurement The tool calculates four distinct data lines:
- Bullish Strength: Represents the momentum of buyers.
- Bearish Strength: Represents the momentum of sellers.
- Bullish Signal: A secondary smoothed line used to identify shifts in buying momentum.
- Bearish Signal: A secondary smoothed line used to identify shifts in selling momentum.
Customization and Logic Flow
The script offers several layers of customization to tailor the data to different trading styles:
- Calculation Methods: Users can choose between three different mathematical models (RSI, Stochastic, or ADX) to determine how "strength" is calculated.
- Smoothing & Sensitivity: The logic includes adjustable periods for smoothing and signal calculations. This allows a user to decide whether they want the indicator to react quickly to price flickers or stay steady to show long-term trends.
- Price Source Selection: The script can calculate its strength based on various price points, such as the opening price, closing price, highs, lows, or weighted averages, depending on the user's preference.
- Data Processing: The tool automatically aligns the time data from the chosen higher time frame with the current chart. It performs a "look-back" to ensure that the strength values displayed are synchronized correctly with the candles currently visible on the screen.
Visual Representation
The indicator appears in a separate window below the main price chart. By visualizing both the primary strength lines and their corresponding signal lines, traders can identify periods where momentum is accelerating, decelerating, or potentially reversing, providing a clearer picture of market dominance.
//+------------------------------------------------------------------+
//|                                      MTF_AbsoluteStrength_v1.mq4 |
//|                           Copyright © 2006, TrendLaboratory Ltd. |
//|            http://finance.groups.yahoo.com/group/TrendLaboratory |
//|                                       E-mail: igorad2004@list.ru |
//+------------------------------------------------------------------+
#property copyright "Copyright © 2006, TrendLaboratory Ltd."
#property link      "http://finance.groups.yahoo.com/group/TrendLaboratory"

#property indicator_separate_window
#property indicator_buffers   4
#property indicator_color1    LightBlue
#property indicator_width1    2
#property indicator_color2    Tomato
#property indicator_width2    2
#property indicator_color3    Aqua
#property indicator_width3    1
#property indicator_style3    3
#property indicator_color4    Orange
#property indicator_width4    1
#property indicator_style4    3
//---- input parameters
extern int       TimeFrame  =  0;
extern int       Mode       =  0; // 0-RSI method; 1-Stoch method; 2-ADX method
extern int       Length     = 10; // Period of evaluation
extern int       Smooth     =  5; // Period of smoothing
extern int       Signal     =  5; // Period of Signal Line
extern int       Price      =  0; // Price mode : 0-Close,1-Open,2-High,3-Low,4-Median,5-Typical,6-Weighted
extern int       ModeMA     =  3; // Mode of Moving Average
extern double    OverBought =  0; // OverBought Level
extern double    OverSold   =  0; // OverSold Level

//---- buffers
double Bulls[];
double Bears[];
double AvgBulls[];
double AvgBears[];
double SmthBulls[];
double SmthBears[];
double SigBulls[];
double SigBears[];

//+------------------------------------------------------------------+
//| Custom indicator initialization function                         |
//+------------------------------------------------------------------+
int init()
  {
//---- indicators
   IndicatorBuffers(8);
   SetIndexStyle(0,DRAW_LINE);
   SetIndexBuffer(0,SmthBulls);
   SetIndexStyle(1,DRAW_LINE);
   SetIndexBuffer(1,SmthBears);
   SetIndexStyle(2,DRAW_LINE);
   SetIndexBuffer(2,SigBulls);
   SetIndexStyle(3,DRAW_LINE);
   SetIndexBuffer(3,SigBears);
   SetIndexBuffer(4,Bulls);
   SetIndexBuffer(5,Bears);
   SetIndexBuffer(6,AvgBulls);
   SetIndexBuffer(7,AvgBears);
//---- name for DataWindow and indicator subwindow label
   switch(TimeFrame)
   {
      case 1      : string TimeFrameStr="Period_M1"; break;
      case 5      : TimeFrameStr="Period_M5"; break;
      case 15     : TimeFrameStr="Period_M15"; break;
      case 30     : TimeFrameStr="Period_M30"; break;
      case 60     : TimeFrameStr="Period_H1"; break;
      case 240    : TimeFrameStr="Period_H4"; break;
      case 1440   : TimeFrameStr="Period_D1"; break;
      case 10080  : TimeFrameStr="Period_W1"; break;
      case 43200  : TimeFrameStr="Period_MN1"; break;
      default     : TimeFrameStr="Current Timeframe";
   }

   string short_name="MTF AbsoluteStrength("+TimeFrameStr+","+Mode+","+Length+","+Smooth+","+Signal+",,"+ModeMA+")";
   IndicatorShortName(short_name);
   SetIndexLabel(0,"Bulls");
   SetIndexLabel(1,"Bears");
   SetIndexLabel(2,"SignalBulls");
   SetIndexLabel(3,"SignalBears");
//----
   SetIndexDrawBegin(0,Length+Smooth+Signal);
   SetIndexDrawBegin(1,Length+Smooth+Signal);
   SetIndexDrawBegin(2,Length+Smooth+Signal);
   SetIndexDrawBegin(3,Length+Smooth+Signal);

   return(0);
  }

//+------------------------------------------------------------------+
//| Custom indicator iteration function                              |
//+------------------------------------------------------------------+
int start()
{
   datetime TimeArray[];
   int      i,limit,y=0,counted_bars=IndicatorCounted();

// Plot defined time frame on to current time frame
   ArrayCopySeries(TimeArray,MODE_TIME,Symbol(),TimeFrame);

   limit=Bars-counted_bars+TimeFrame/Period();
   for(i=0,y=0;i<limit;i++)
   {
   if (Time[i]<TimeArray[y]) y++;
   SmthBulls[i] =
   iCustom(NULL,TimeFrame,"AbsoluteStrength_v1.1",Mode,Length,Smooth,Signal,Price,ModeMA,OverBought,OverSold,0,y);
   SmthBears[i] =
   iCustom(NULL,TimeFrame,"AbsoluteStrength_v1.1",Mode,Length,Smooth,Signal,Price,ModeMA,OverBought,OverSold,1,y);
   SigBulls[i] =
   iCustom(NULL,TimeFrame,"AbsoluteStrength_v1.1",Mode,Length,Smooth,Signal,Price,ModeMA,OverBought,OverSold,2,y);
   SigBears[i] =
   iCustom(NULL,TimeFrame,"AbsoluteStrength_v1.1",Mode,Length,Smooth,Signal,Price,ModeMA,OverBought,OverSold,3,y);
   }


//----

   return(0);
  }
//+------------------------------------------------------------------+
Comments