MTF_ADX_WildersDMI_v1m_v1
Download script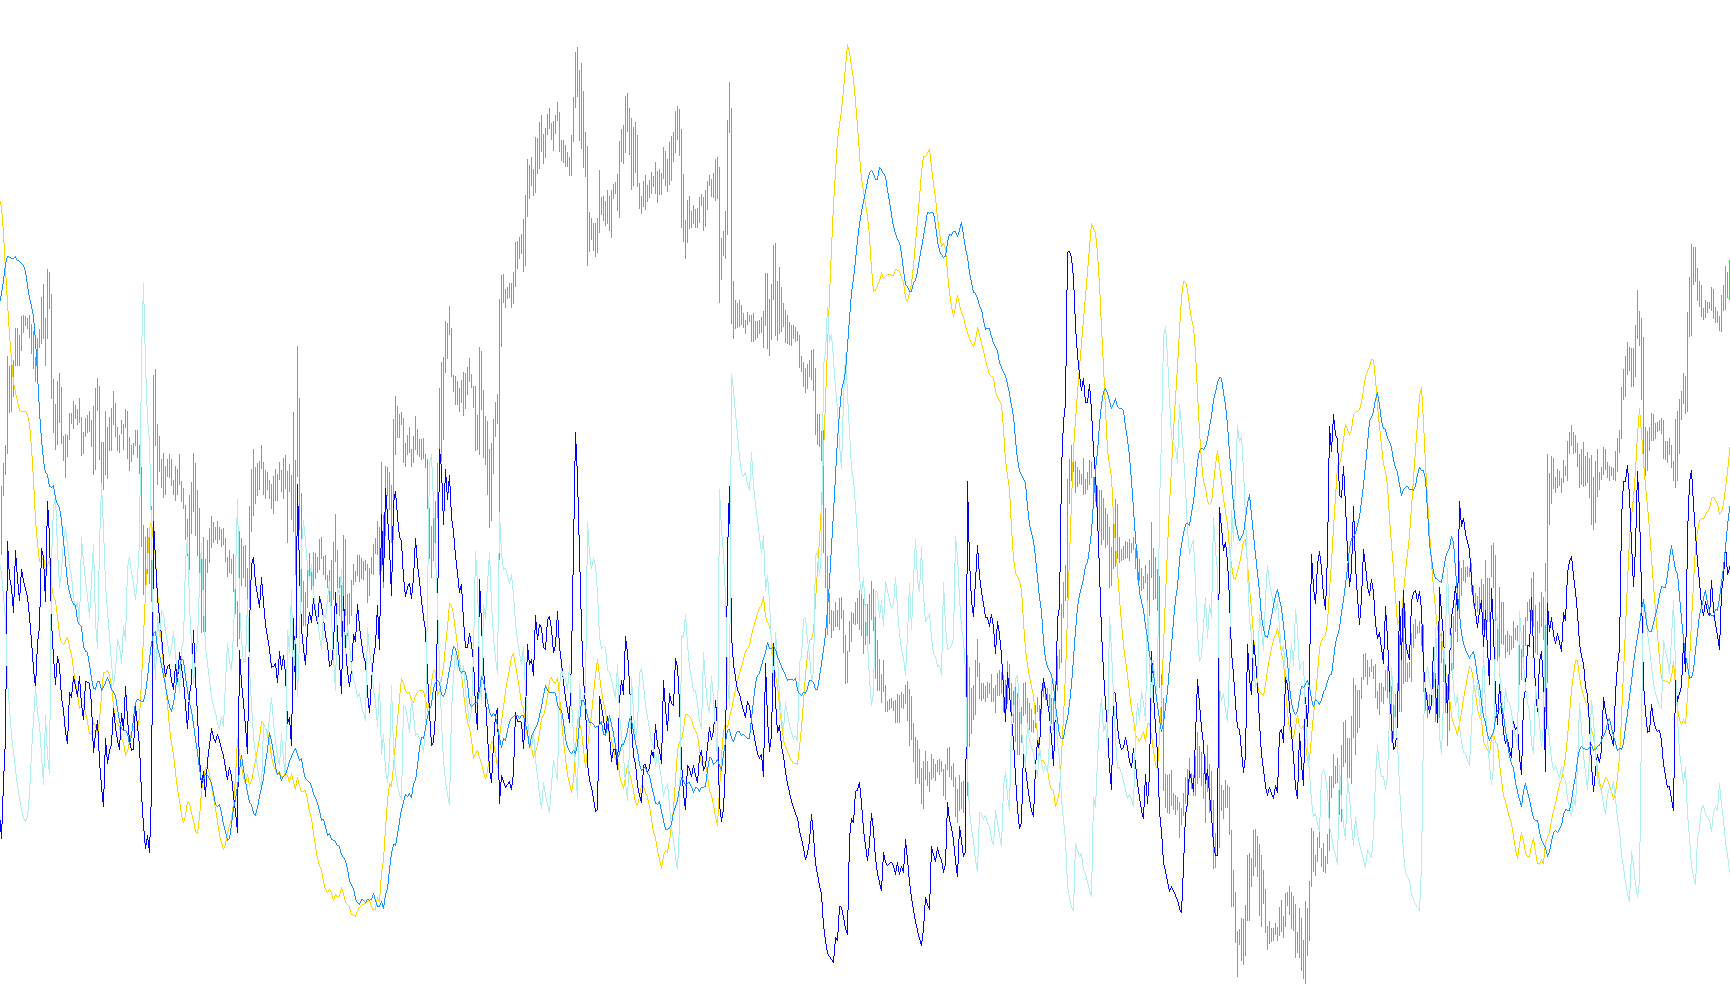
This tool is a multi-timeframe technical indicator designed to help traders analyze market trends and momentum by pulling data from different time periods into a single view. Instead of forcing you to switch back and forth between various charts (like moving from a 1-hour chart to a daily chart), this script consolidates that information into one window.
Core Functionality
The logic works by "mapping" specific market signals from a higher or different timeframe onto your current viewing screen. It looks at the price action of a chosen period—which you can customize—and calculates four distinct metrics simultaneously:
- Trend Strength (ADX): This measures how powerful the current trend is, regardless of whether the price is moving up or down.
- Buying Pressure (+DI): This identifies the momentum specifically associated with upward price movement.
- Selling Pressure (-DI): This identifies the momentum associated with downward price movement.
- Trend Smoothing (ADXR): A secondary calculation used to provide a smoother representation of the trend, helping to filter out minor market noise.
How It Works for the User
- Timeframe Selection: The script allows you to choose a specific timeframe (e.g., M15, H1, D1). Even if you are looking at a 5-minute chart, the indicator can display the trend data from the 4-hour or Daily charts.
- Data Synchronization: Because different timeframes have different numbers of bars, the script includes internal logic to align the timing correctly. It ensures that the "current" value on your screen matches the correct corresponding point in time on the larger timeframe you selected.
- Visual Representation: The results are displayed as four separate lines in a single sub-window. By watching these lines interact, you can see if the broader market trend supports the short-term price action you are currently observing.
Key Benefits
- Contextual Awareness: It provides a "big picture" view, helping you avoid entering trades against a strong prevailing trend on a higher timeframe.
- Consolidated Analysis: It saves time by eliminating the need to manually open multiple charts to verify market conditions.
- Customizable Sensitivity: You can adjust the lengths of the calculations (the "smoothing" factors) to suit your specific trading style, whether you prefer highly responsive data or more stable, delayed signals.
Miscellaneous
11
Views
0
Downloads
0
Favorites
MTF_ADX_WildersDMI_v1m_v1
//+------------------------------------------------------------------+
//|                                            MTF_WildersDMI_v1.mq4 |
//|                            Copyright © 2007, TrendLaboratory Ltd |
//|            http://finance.groups.yahoo.com/group/TrendLaboratory |
//|              www.forex-tsd.com        E-mail: igorad2004@list.ru |
//+------------------------------------------------------------------+
#property copyright "Copyright © 2007, TrendLaboratory Ltd."
#property link      "http://finance.groups.yahoo.com/group/TrendLaboratory"
//----
#property indicator_separate_window
#property indicator_buffers   4
#property indicator_color1    LightBlue
#property indicator_width1    2
#property indicator_color2    Lime
#property indicator_width2    1
#property indicator_style2    2
#property indicator_color3    Tomato
#property indicator_width3    1
#property indicator_style3    2
#property indicator_color4    Orange
#property indicator_width4    2
#property indicator_level1    20
//---- input parameters
extern int       TimeFrame  =0;
extern int       MA_Length  =1;
extern int       DMI_Length  =14;
extern int       ADX_Length  =14;
extern int       ADXR_Length =14;
extern int       UseADX     =1;
extern int       UseADXR    =1;
//---- buffers
double ExtMapBufferADX[];
double ExtMapBufferPDI[];
double ExtMapBufferMDI[];
double ExtMapBufferADXR[];
double sPDI[];
double sMDI[];
double STR[];
double DX[];
//+------------------------------------------------------------------+
//| Custom indicator initialization function                         |
//+------------------------------------------------------------------+
int init()
  {
//---- indicators
   IndicatorBuffers(8);
   SetIndexStyle(0,DRAW_LINE);
   SetIndexBuffer(0,ExtMapBufferADX);
   SetIndexStyle(1,DRAW_LINE);
   SetIndexBuffer(1,ExtMapBufferPDI);
   SetIndexStyle(2,DRAW_LINE);
   SetIndexBuffer(2,ExtMapBufferMDI);
   SetIndexStyle(3,DRAW_LINE);
   SetIndexBuffer(3,ExtMapBufferADXR);
//---- name for DataWindow and indicator subwindow label
   string short_name="MTF ADXWildersDMI("+MA_Length+","+DMI_Length+","+ADX_Length+","+ADXR_Length+";TF("+TimeFrame+")";
   IndicatorShortName(short_name);
   SetIndexLabel(0,"MTF_ADX ("+ADX_Length+"("+TimeFrame+")");
   SetIndexLabel(1,"MTF_ADX+DI ("+ADX_Length+"("+TimeFrame+"");
   SetIndexLabel(2,"MTF_ADX-DI("+ADX_Length+"("+TimeFrame+"");
   SetIndexLabel(3,"MTF_ADXR("+ADXR_Length+"("+TimeFrame+"");
//----
   SetIndexDrawBegin(0,DMI_Length+MA_Length);
   SetIndexDrawBegin(1,DMI_Length+MA_Length);
   SetIndexDrawBegin(2,DMI_Length+MA_Length);
   SetIndexDrawBegin(3,DMI_Length+MA_Length);
//---- name for DataWindow and indicator subwindow label
   switch(TimeFrame)
     {
      case 1 : string TimeFrameStr="Period_M1"; break;
      case 5 : TimeFrameStr="Period_M5"; break;
      case 15 : TimeFrameStr="Period_M15"; break;
      case 30 : TimeFrameStr="Period_M30"; break;
      case 60 : TimeFrameStr="Period_H1"; break;
      case 240 : TimeFrameStr="Period_H4"; break;
      case 1440 : TimeFrameStr="Period_D1"; break;
      case 10080 : TimeFrameStr="Period_W1"; break;
      case 43200 : TimeFrameStr="Period_MN1"; break;
      default : TimeFrameStr="Current Timeframe";
     }
   return(0);
  }
//+------------------------------------------------------------------+
//| MTF                                                              |
//+------------------------------------------------------------------+
int start()
  {
   datetime TimeArray[];
   int    i,limit,y=0,counted_bars=IndicatorCounted();
   // Plot defined time frame on to current time frame
   ArrayCopySeries(TimeArray,MODE_TIME,Symbol(),TimeFrame);
   limit=Bars-counted_bars+TimeFrame/Period();
   for(i=0,y=0;i<counted_bars;i++)
     {
      if (Time[i]<TimeArray[y]) y++;
/***********************************************************
   Add your main indicator loop below.  You can reference an existing
   indicator with its iName  or iCustom.
   Rule 1:  Add extern inputs above for all neccesary values
   Rule 2:  Use 'TimeFrame' for the indicator time frame
   Rule 3:  Use 'y' for your indicator's shift value
***********************************************************/
      ExtMapBufferADX [i]=iCustom(NULL,TimeFrame,"ADX_WildersDMI_v1m",MA_Length,DMI_Length,ADX_Length,ADXR_Length,0,y);
      ExtMapBufferPDI [i]=iCustom(NULL,TimeFrame,"ADX_WildersDMI_v1m",MA_Length,DMI_Length,ADX_Length,ADXR_Length,1,y);
      ExtMapBufferMDI [i]=iCustom(NULL,TimeFrame,"ADX_WildersDMI_v1m",MA_Length,DMI_Length,ADX_Length,ADXR_Length,2,y);
      ExtMapBufferADXR[i]=iCustom(NULL,TimeFrame,"ADX_WildersDMI_v1m",MA_Length,DMI_Length,ADX_Length,ADXR_Length,3,y);
     }
   return(0);
  }
//+------------------------------------------------------------------+
Comments