MTF_AbsoluteStrength_v1.1SideBAR
Download script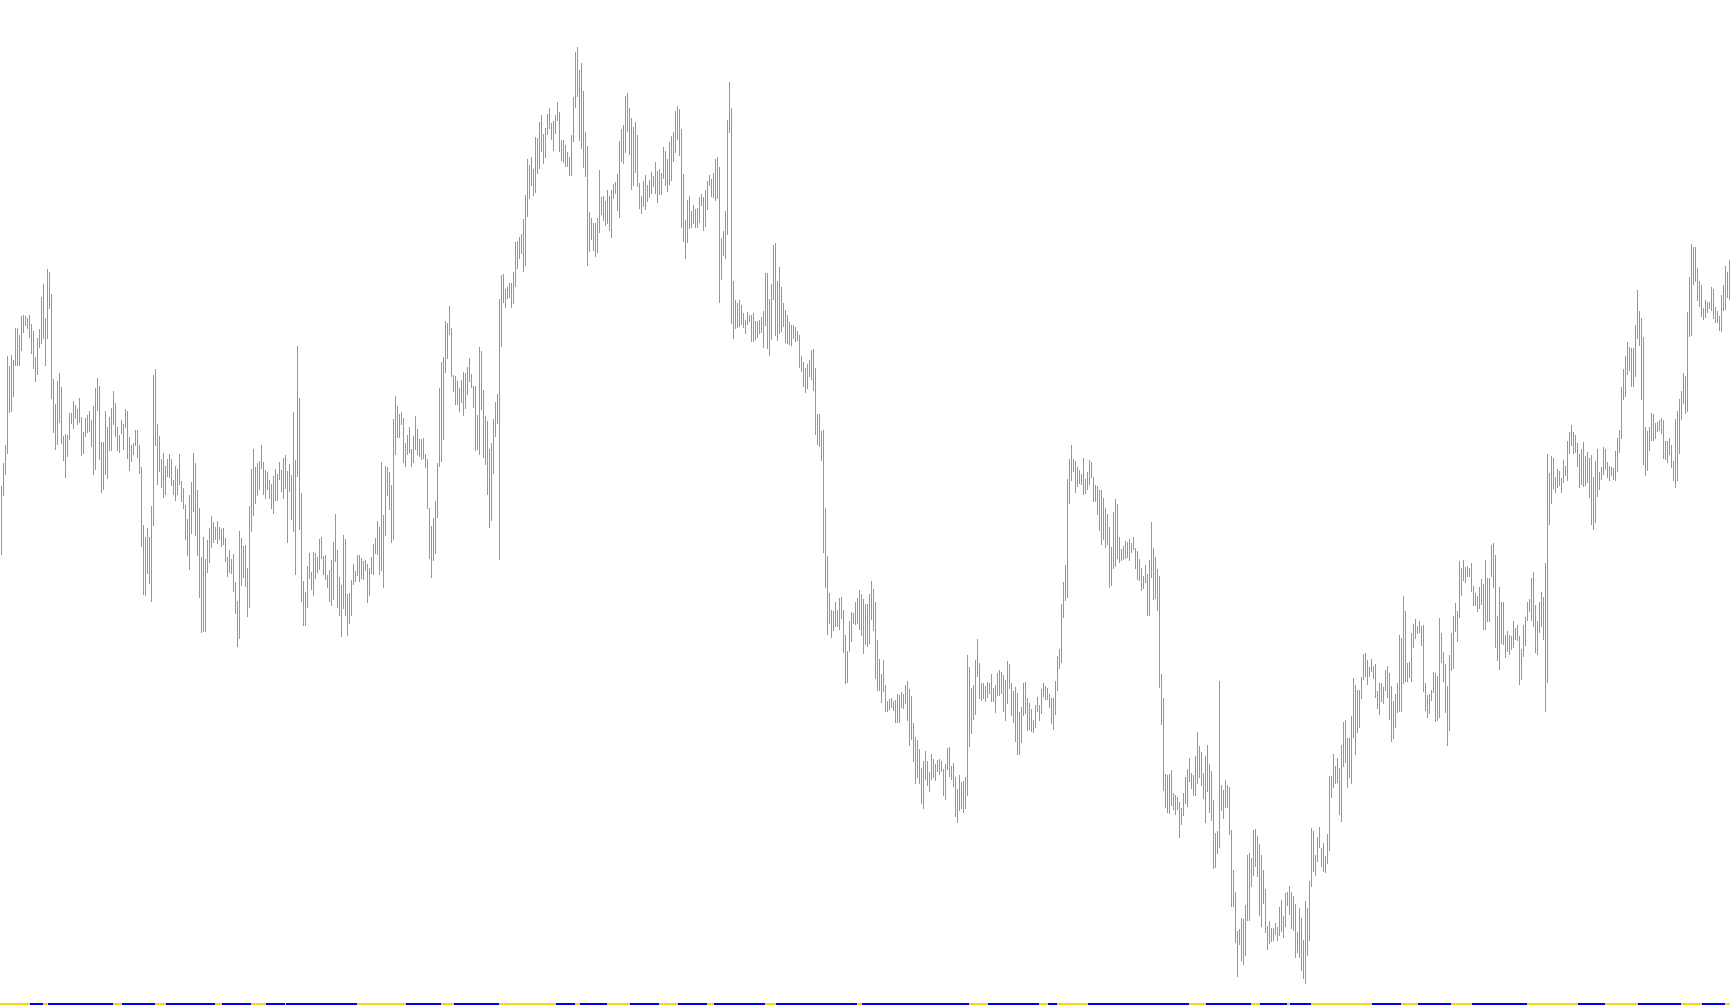
This script is designed as a multi-timeframe (MTF) analysis tool for MetaTrader. Its primary purpose is to visualize market sentiment and price momentum by comparing "Bullish" versus "Bearish" forces across different timeframes simultaneously.
Instead of just looking at the current chart, this tool pulls data from a higher timeframe (which you can choose in the settings) and projects that information onto your current screen. This allows a trader to see the "big picture" trends without switching windows constantly.
Core Logic and Market Interpretation
The script operates by calculating several different signals based on technical indicators (such as RSI or Stochastic oscillators). It processes these calculations to categorize the market into seven distinct visual states:
1. Momentum and Directional Strength
- Strong Up: This appears when the bullish momentum is significantly stronger than the bearish momentum, and it exceeds a specific signal threshold. This indicates a high-confidence upward trend.
- Up Correction: This identifies a situation where bulls are still leading, but the momentum is weakening or pulling back slightly. It suggests the market is moving up but might be taking a breather.
- Strong Down: The inverse of Strong Up; this signals dominant bearish momentum that has surpassed a specific threshold, indicating high-confidence downward movement.
- Down Correction: This identifies a situation where bears are leading but the momentum is showing signs of slowing down or pulling back.
2. Conflict and Neutrality Zones
- Two Forces On (Caution): This is a unique alert logic. It triggers when both bullish and bearish momenta are high and active at the same time. In professional trading terms, this often represents a "choppy" market or a period of high volatility where neither side has gained clear control.
- No Interest (No Trade Zone): This appears when both bullish and bearish forces are significantly weak. It suggests a lack of market participation or a stagnant price action, signaling that it may be an unfavorable time to enter a trade.
3. General Sentiment Tracking
- Bulls/Bears: The script also maintains a constant background tracker for the general balance of power. It continuously compares the raw bullish strength against bearish strength to show who is currently "in the lead," regardless of whether that lead is "strong" enough to trigger a specific signal.
Summary of Visual Behavior
The indicator uses a dedicated sub-window and employs various colors and symbols to communicate these states instantly:
- Blue/Turquoise tones represent varying degrees of Bullish activity (Strong vs. Correction).
- Red/Tomato tones represent varying degrees of Bearish activity (Strong vs. Correction).
- Gold serves as a warning for conflicting forces (Two Forces On).
- White marks the "No Interest" zones where market activity is too low to be actionable.
//+-------------------------------------------------------------------------------+
//| MTF_ASv1.1DHsBarM2:     SideBar                  AbsoluteStrength_v1.1 & MTF  |
//|                                        Copyright © 2006, TrendLaboratory Ltd. |
//|                         http://finance.groups.yahoo.com/group/TrendLaboratory |
//|   www.ForexTSD.com                                 E-mail: igorad2004@list.ru |
//|            Signals according to Igorad & Newdigital Rules    (cattus)     ik  |
//+-------------------------------------------------------------------------------+

#property copyright "Copyright © 2006, TrendLaboratory Ltd."
#property link      "http://finance.groups.yahoo.com/group/TrendLaboratory"

#property indicator_separate_window
#property indicator_maximum 77
#property indicator_minimum 1
#property indicator_buffers   8
#property indicator_color1    RoyalBlue // bulls>bears
#property indicator_width1    0
#property indicator_color2    Sienna //LightSeaGreen / bulls<bears
#property indicator_width2    0
#property indicator_style2    0
#property indicator_color3    Blue //Signal StrongUp
#property indicator_width3    1
#property indicator_color4    MediumTurquoise //Signal Up;corr
#property indicator_width4    1
#property indicator_color5    Red //Signal StrongDown
#property indicator_width5    1
#property indicator_color6    Tomato//IndianRed //Signal Down; corr
#property indicator_width6    1
#property indicator_color7    Gold //Two forces strong
#property indicator_width7    1
#property indicator_color8    White //Signal No Interest
#property indicator_width8    1

//---- input parameters
extern int       TimeFrame=0;

extern int ASbarLevel = 30; // bar location in sep.windpw(from 1(min) to 77(max))
extern int       Mode =  0; // 0-RSI method; 1-Stoch method
extern string    note_BarLevel_Mode = "ASBarLevel:1-21;Mode:RSI-0;Stoch1;ADX2";
extern int       Length = 10; // Period
extern int       Smooth =  5; // Period of smoothing
extern int       Signal =  5; // Period of Signal Line
extern int       Price  =  0; // Price mode : 0-Close,1-Open,2-High,3-Low,4-Median,5-Typical,6-Weighted
extern int       ModeMA =  3; // Mode of Moving Average: SMA0,EMA1,SmdMA2,LWMA3
extern string    note_Price_ModeMa = "Price(OCHLMTF)ModeMa(SMA0,EMA1,SmmMA2,LWMA3";
extern string    Signals_Up = "StrongUp,Correction: Blue,DogerBlue";
extern string    Signals_Down = "StrongDn,Correction: Red,IndianRed";
extern string    Sinal_TwoForcesOn = "Caution,DirChangePosbl:TwoForcesOn; Yellow";
extern string    Sinal_NoInterest = "NoTradeZone-NoInterest:Bulls&BearsDown; White";

/*************************************************************************
PERIOD_M1   1
PERIOD_M5   5
PERIOD_M15  15
PERIOD_M30  30
PERIOD_H1   60
PERIOD_H4   240
PERIOD_D1   1440
PERIOD_W1   10080
PERIOD_MN1  43200
You must use the numeric value of the timeframe that you want to use
when you set the TimeFrame' value with the indicator inputs.
---------------------------------------
MODE_SMA    0 Simple moving average,
MODE_EMA    1 Exponential moving average,
MODE_SMMA   2 Smoothed moving average,
MODE_LWMA   3 Linear weighted moving average.
You must use the numeric value of the MA Method that you want to use
when you set the 'ma_method' value with the indicator inputs.

**********************************************************/

//---- buffers


double SmthBulls[];
double SmthBears[];
double SigBulls[];
double SigBears[];

double Bulls_Bears[];
double Bears_Bulls[];

double SigStrongUp[];
double SigUpCorrection[];
double SigStrongDown[];
double SigDownCorrection[];
double SigTwoForcesOn[];
double SigNoTrade[];


//+------------------------------------------------------------------+
//| Custom indicator initialization function                         |
//+------------------------------------------------------------------+
int init()
  {
//---- indicators
 //  IndicatorBuffers(8);
   SetIndexBuffer(0,Bulls_Bears);
   SetIndexStyle(0,DRAW_ARROW);
    SetIndexArrow(0,110);  //square:110//(hollow square:111,112;//59;250;249-hollow rectangle)//
   SetIndexBuffer(1,Bears_Bulls);
  SetIndexStyle(1,DRAW_ARROW);
   SetIndexArrow(1,110);

   SetIndexBuffer(2,SigStrongUp);
   SetIndexStyle(2,DRAW_ARROW);
   SetIndexArrow(2,159);

   SetIndexBuffer(3,SigUpCorrection);
   SetIndexStyle(3,DRAW_ARROW);
   SetIndexArrow(3,159);

   SetIndexBuffer(4,SigStrongDown);
   SetIndexStyle(4,DRAW_ARROW);
   SetIndexArrow(4,159);

   SetIndexBuffer(5,SigDownCorrection);
   SetIndexStyle(5,DRAW_ARROW);
   SetIndexArrow(5,159);

   SetIndexBuffer(6,SigTwoForcesOn);
   SetIndexStyle(6,DRAW_ARROW);
   SetIndexArrow(6,159);

   SetIndexBuffer(7,SigNoTrade);
   SetIndexStyle(7,DRAW_ARROW);
   SetIndexArrow(7,159);


//    SetIndexEmptyValue(4,EMPTY_VALUE);
//---- name for DataWindow and indicator subwindow label
   string short_name="MTF_AbsStrDHs["+TimeFrame+"]"+Mode+","+Length+","+Smooth+","+Signal+","+ModeMA+")";
   IndicatorShortName(short_name);
   SetIndexLabel(0,"Bulls/Bears; tf("+TimeFrame+")");
   SetIndexLabel(1,"Bears/Bulls; tf("+TimeFrame+")");
   SetIndexLabel(2,"StrongUp,tf("+TimeFrame+")");
   SetIndexLabel(3,"UpCorr,tf("+TimeFrame+")");
   SetIndexLabel(4,"StrongDown,tf("+TimeFrame+")");
   SetIndexLabel(5,"DownCorr,tf("+TimeFrame+")");
   SetIndexLabel(6,"TwoForcesOn("+TimeFrame+")");
   SetIndexLabel(7,"NoTrade("+TimeFrame+")");

//----
   SetIndexDrawBegin(0,Length+Smooth+Signal);
   SetIndexDrawBegin(1,Length+Smooth+Signal);
   SetIndexDrawBegin(2,Length+Smooth+Signal);
   SetIndexDrawBegin(3,Length+Smooth+Signal);
   SetIndexDrawBegin(4,Length+Smooth+Signal);
   SetIndexDrawBegin(5,Length+Smooth+Signal);
   SetIndexDrawBegin(6,Length+Smooth+Signal);
   SetIndexDrawBegin(7,Length+Smooth+Signal);

//---- name for DataWindow and indicator subwindow label
   switch(TimeFrame)
   {
      case 1 : string TimeFrameStr="Period_M1"; break;
      case 5 : TimeFrameStr="Period_M5"; break;
      case 15 : TimeFrameStr="Period_M15"; break;
      case 30 : TimeFrameStr="Period_M30"; break;
      case 60 : TimeFrameStr="Period_H1"; break;
      case 240 : TimeFrameStr="Period_H4"; break;
      case 1440 : TimeFrameStr="Period_D1"; break;
      case 10080 : TimeFrameStr="Period_W1"; break;
      case 43200 : TimeFrameStr="Period_MN1"; break;
      default : TimeFrameStr="Current Timeframe";
  }
   return(0);
  }
//+------------------------------------------------------------------+
//| MTF                                                              |
//+------------------------------------------------------------------+
int start()
  {
   datetime TimeArray[];
   int    i,limit,y=0,counted_bars=IndicatorCounted();

// Plot defined time frame on to current time frame
   ArrayCopySeries(TimeArray,MODE_TIME,Symbol(),TimeFrame);

   limit=Bars-counted_bars+TimeFrame/Period();
   for(i=0,y=0;i<limit;i++)
   {
   if (Time[i]<TimeArray[y]) y++;

/***********************************************************
   Add your main indicator loop below.  You can reference an existing
      indicator with its iName  or iCustom.
   Rule 1:  Add extern inputs above for all neccesary values
   Rule 2:  Use 'TimeFrame' for the indicator time frame
   Rule 3:  Use 'y' for your indicator's shift value
 **********************************************************/


double SmthBulls   =iCustom(NULL,TimeFrame,"AbsoluteStrength_v1.1",  Mode, Length,Smooth, Signal, Price, ModeMA,0,0,0,y);
double SmthBears   =iCustom(NULL,TimeFrame,"AbsoluteStrength_v1.1",  Mode, Length,Smooth, Signal, Price, ModeMA,0,0,1,y);
double SigBulls    =iCustom(NULL,TimeFrame,"AbsoluteStrength_v1.1",  Mode, Length,Smooth, Signal, Price, ModeMA,0,0,2,y);
double SigBears    =iCustom(NULL,TimeFrame,"AbsoluteStrength_v1.1",  Mode, Length,Smooth, Signal, Price, ModeMA,0,0,3,y);

      SigStrongUp[i] = EMPTY_VALUE;
      SigUpCorrection[i] = EMPTY_VALUE;
      SigStrongDown[i] = EMPTY_VALUE;
      SigDownCorrection[i] = EMPTY_VALUE;
      SigTwoForcesOn[i] = EMPTY_VALUE;
      SigNoTrade[i] = EMPTY_VALUE;
      Bulls_Bears[i] = EMPTY_VALUE;
      Bears_Bulls[i] = EMPTY_VALUE;

      if(SmthBulls>=SmthBears && SmthBulls>=SigBulls && SmthBears<SigBears) SigStrongUp[i] = ASbarLevel;//Blue
      if(SmthBulls>=SmthBears && SmthBulls<SigBulls && SmthBears>=SigBears) SigUpCorrection[i] = ASbarLevel;//DodgerBlue UpCorrection

      if(SmthBulls<SmthBears && SmthBulls<SigBulls && SmthBears>=SigBears) SigStrongDown[i] = ASbarLevel;//Red
      if(SmthBulls<SmthBears && SmthBulls>=SigBulls && SmthBears<SigBears) SigDownCorrection[i] = ASbarLevel;//IndianRed DnCorrection

      if(SmthBears>SigBears && SmthBulls>SigBulls) SigTwoForcesOn[i] = ASbarLevel;//Gold
      if(SmthBulls<SigBulls && SmthBears<SigBears) SigNoTrade[i] = ASbarLevel;//White

      if(SmthBulls>SmthBears) Bulls_Bears[i] = ASbarLevel;//LightBlue
      if(SmthBulls<=SmthBears) Bears_Bulls[i] = ASbarLevel;//IndianRed


   }


//
    //----  Refresh buffers ++++++++++++++++++++ upgrade by Raff
     int TimeFrame;   if (TimeFrame>Period()) {
     int PerINT=TimeFrame/Period()+1;
     datetime TimeArr[]; ArrayResize(TimeArr,PerINT);
     ArrayCopySeries(TimeArr,MODE_TIME,Symbol(),Period());
     for(i=0;i<PerINT+1;i++) {if (TimeArr[i]>=TimeArray[0]) {
 /********************************************************
    Refresh buffers:         buffer[i] = buffer[0];
 ********************************************************/

    Bulls_Bears[i] =  Bulls_Bears[0];
    Bears_Bulls[i] = Bears_Bulls[0];
    //  SigBulls[i] = SigBulls[0];
   //   SigBears[i] = SigBears[0];
      SigStrongUp[i] = SigStrongUp[0];
      SigUpCorrection[i] = SigUpCorrection[0];
      SigStrongDown[i] = SigStrongDown[0];
      SigDownCorrection[i] = SigDownCorrection[0];
      SigTwoForcesOn[i] = SigTwoForcesOn[0];
      SigNoTrade[i]= SigNoTrade[0];

 //--
   } } }
//+++++++++++++++++++++++++++++++++++++++++++++++++++  Raff

   return(0);
  }
//+-----------
Comments