MTF_AbsoluteStrength_v1.1
Download script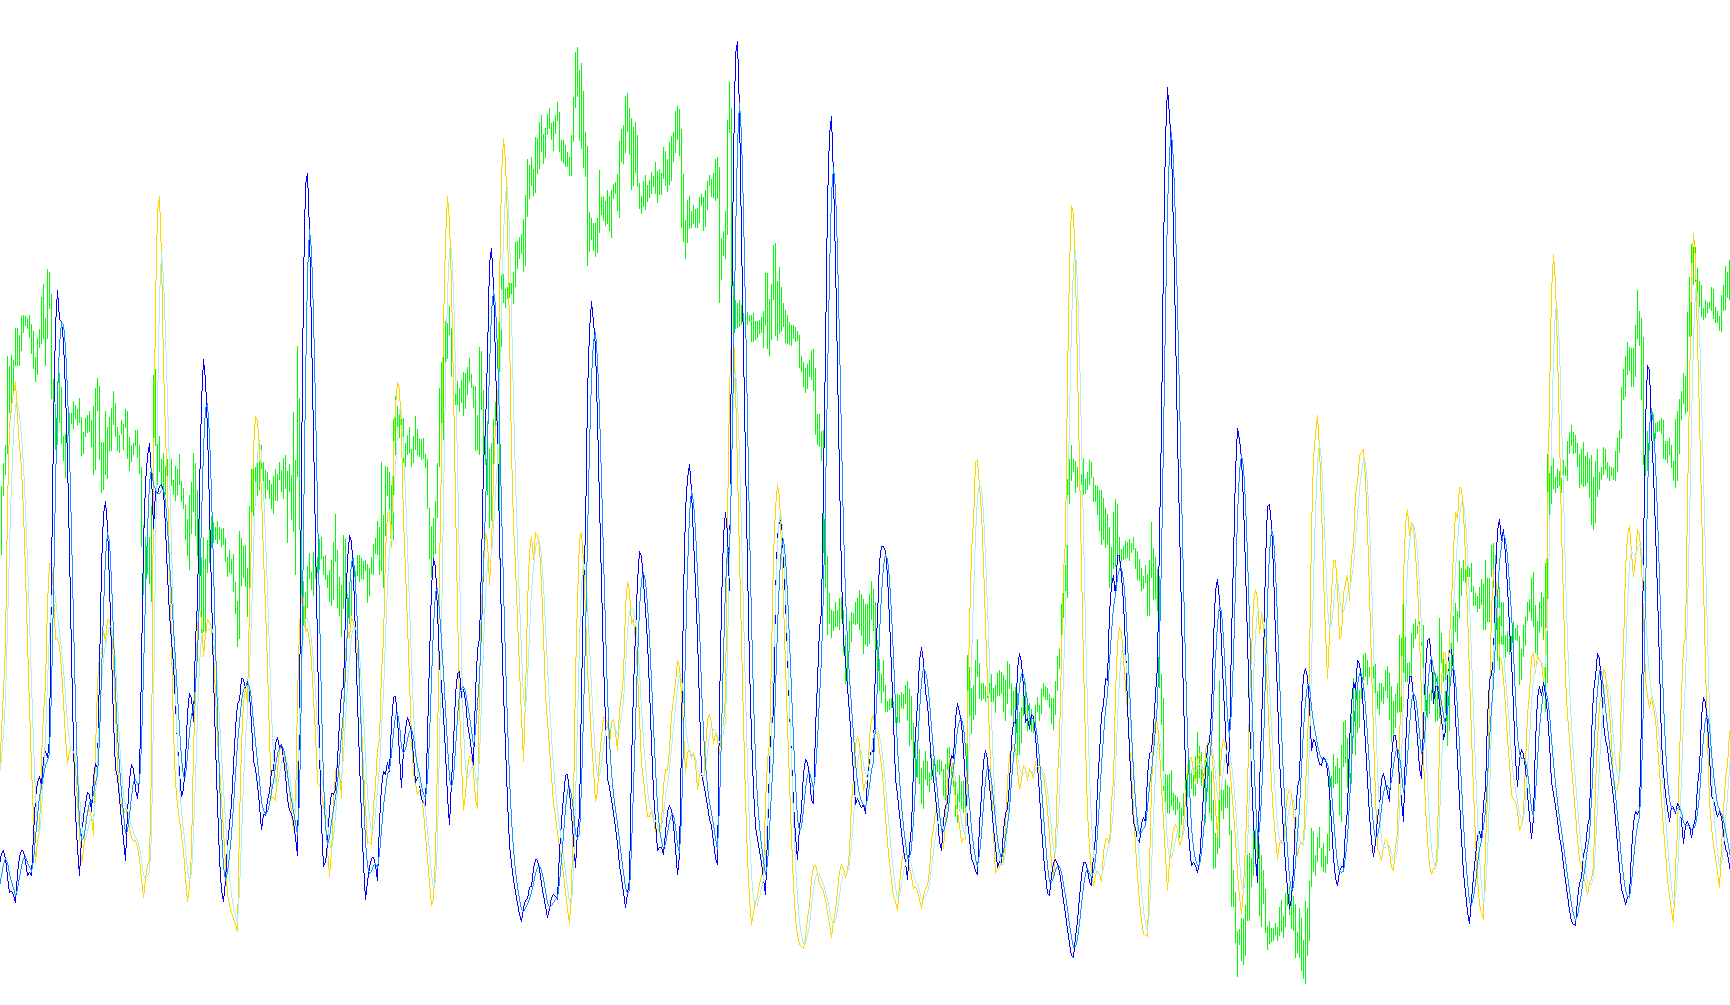
This tool is designed to provide traders with a clear visualization of market sentiment by measuring the "absolute strength" of buying and selling pressures. Instead of looking at price alone, it analyzes the underlying momentum to help identify which side—the bulls (buyers) or the bears (sellers)—is currently dominating the market.
Core Functionality
The script operates by pulling data from multiple sources to create a comprehensive view of market dynamics. It calculates four distinct components:
- Bullish Strength: The primary trend of buying pressure.
- Bearish Strength: The primary trend of selling pressure.
- Bullish Signal: A secondary line that smooths the bullish data to identify potential shifts or confirmations.
- Bearish Signal: A secondary line that smooths the bearish data to identify potential shifts or confirmations.
How the Logic Works
The indicator follows a multi-layered calculation process:
- Data Source Selection: You can choose how the tool calculates strength based on three different mathematical models (RSI, Stochastic, or ADX). This allows the user to toggle between different styles of momentum analysis depending on their trading strategy.
- Multi-Timeframe Analysis: One of the key features is its ability to "look ahead" at higher timeframes. While you view your chart on a smaller timeframe (like 5 minutes), the script can automatically fetch and project data from larger intervals (like Hourly or Daily). This helps traders see the "big picture" without constantly switching screens.
- Smoothing and Filtering: To ensure the data isn't too erratic or "noisy," the script applies multiple layers of smoothing. This filters out minor market fluctuations, leaving behind a clearer trend line that is easier to interpret visually.
- Price Weighting: The logic can be adjusted to calculate strength based on different price types—such as the opening price, closing price, the highest/lowest reached during a period, or a weighted average of these figures.
Visual Interpretation
By displaying these lines in a separate window below your main chart, the tool allows for a quick visual audit:
- When the Bullish lines are significantly higher than the Bearish lines, it suggests dominant buying pressure.
- When the Bearish lines take the lead, it indicates a shift toward selling pressure.
- The "Signal" lines act as a secondary confirmation; when these lines move in harmony with the primary strength lines, it often confirms the reliability of the current trend.
In summary, this script acts as a sentiment thermometer, translating complex price movements into readable trends that highlight whether the market is leaning toward growth or decline across various timeframes simultaneously.
//+------------------------------------------------------------------+
//|                                    MTF_AbsoluteStrength_v1.1.mq4 |
//|                           Copyright © 2006, TrendLaboratory Ltd. |
//|            http://finance.groups.yahoo.com/group/TrendLaboratory |
//|                                       E-mail: igorad2004@list.ru |
//+------------------------------------------------------------------+
#property copyright "Copyright © 2006, TrendLaboratory Ltd."
#property link      "http://finance.groups.yahoo.com/group/TrendLaboratory"

#property indicator_separate_window
#property indicator_buffers   4
#property indicator_color1    LightBlue
#property indicator_width1    2
#property indicator_color2    Tomato
#property indicator_width2    2
#property indicator_color3    Aqua
#property indicator_width3    1
#property indicator_style3    3
#property indicator_color4    Orange
#property indicator_width4    1
#property indicator_style4    3
//---- input parameters
extern int       TimeFrame  =  0;
extern int       Mode       =  0; // 0-RSI method; 1-Stoch method; 2-ADX method
extern int       Length     = 10; // Period of evaluation
extern int       Smooth     =  5; // Period of smoothing
extern int       Signal     =  5; // Period of Signal Line
extern int       Price      =  0; // Price mode : 0-Close,1-Open,2-High,3-Low,4-Median,5-Typical,6-Weighted
extern int       ModeMA     =  3; // Mode of Moving Average
extern double    OverBought =  0; // OverBought Level
extern double    OverSold   =  0; // OverSold Level

//---- buffers
double Bulls[];
double Bears[];
double AvgBulls[];
double AvgBears[];
double SmthBulls[];
double SmthBears[];
double SigBulls[];
double SigBears[];

//+------------------------------------------------------------------+
//| Custom indicator initialization function                         |
//+------------------------------------------------------------------+
int init()
  {
//---- indicators
   IndicatorBuffers(8);
   SetIndexStyle(0,DRAW_LINE);
   SetIndexBuffer(0,SmthBulls);
   SetIndexStyle(1,DRAW_LINE);
   SetIndexBuffer(1,SmthBears);
   SetIndexStyle(2,DRAW_LINE);
   SetIndexBuffer(2,SigBulls);
   SetIndexStyle(3,DRAW_LINE);
   SetIndexBuffer(3,SigBears);
   SetIndexBuffer(4,Bulls);
   SetIndexBuffer(5,Bears);
   SetIndexBuffer(6,AvgBulls);
   SetIndexBuffer(7,AvgBears);
//---- name for DataWindow and indicator subwindow label
   switch(TimeFrame)
   {
      case 1      : string TimeFrameStr="Period_M1"; break;
      case 5      : TimeFrameStr="Period_M5"; break;
      case 15     : TimeFrameStr="Period_M15"; break;
      case 30     : TimeFrameStr="Period_M30"; break;
      case 60     : TimeFrameStr="Period_H1"; break;
      case 240    : TimeFrameStr="Period_H4"; break;
      case 1440   : TimeFrameStr="Period_D1"; break;
      case 10080  : TimeFrameStr="Period_W1"; break;
      case 43200  : TimeFrameStr="Period_MN1"; break;
      default     : TimeFrameStr="Current Timeframe";
   }

   string short_name="MTF AbsoluteStrength("+TimeFrameStr+","+Mode+","+Length+","+Smooth+","+Signal+",,"+ModeMA+")";
   IndicatorShortName(short_name);
   SetIndexLabel(0,"Bulls");
   SetIndexLabel(1,"Bears");
   SetIndexLabel(2,"SignalBulls");
   SetIndexLabel(3,"SignalBears");
//----
   SetIndexDrawBegin(0,Length+Smooth+Signal);
   SetIndexDrawBegin(1,Length+Smooth+Signal);
   SetIndexDrawBegin(2,Length+Smooth+Signal);
   SetIndexDrawBegin(3,Length+Smooth+Signal);

   return(0);
  }

//+------------------------------------------------------------------+
//| Custom indicator iteration function                              |
//+------------------------------------------------------------------+
int start()
{
   datetime TimeArray[];
   int      i,limit,y=0,counted_bars=IndicatorCounted();

// Plot defined time frame on to current time frame
   ArrayCopySeries(TimeArray,MODE_TIME,Symbol(),TimeFrame);

   limit=Bars-counted_bars+TimeFrame/Period();
   for(i=0,y=0;i<limit;i++)
   {
   if (Time[i]<TimeArray[y]) y++;
   SmthBulls[i] =
   iCustom(NULL,TimeFrame,"AbsoluteStrength_v1.1",Mode,Length,Smooth,Signal,Price,ModeMA,OverBought,OverSold,0,y);
   SmthBears[i] =
   iCustom(NULL,TimeFrame,"AbsoluteStrength_v1.1",Mode,Length,Smooth,Signal,Price,ModeMA,OverBought,OverSold,1,y);
   SigBulls[i] =
   iCustom(NULL,TimeFrame,"AbsoluteStrength_v1.1",Mode,Length,Smooth,Signal,Price,ModeMA,OverBought,OverSold,2,y);
   SigBears[i] =
   iCustom(NULL,TimeFrame,"AbsoluteStrength_v1.1",Mode,Length,Smooth,Signal,Price,ModeMA,OverBought,OverSold,3,y);
   }


//----

   return(0);
  }
//+------------------------------------------------------------------+
Comments