FX5_SelfAdjustingRSI_v1.0[1]
Download script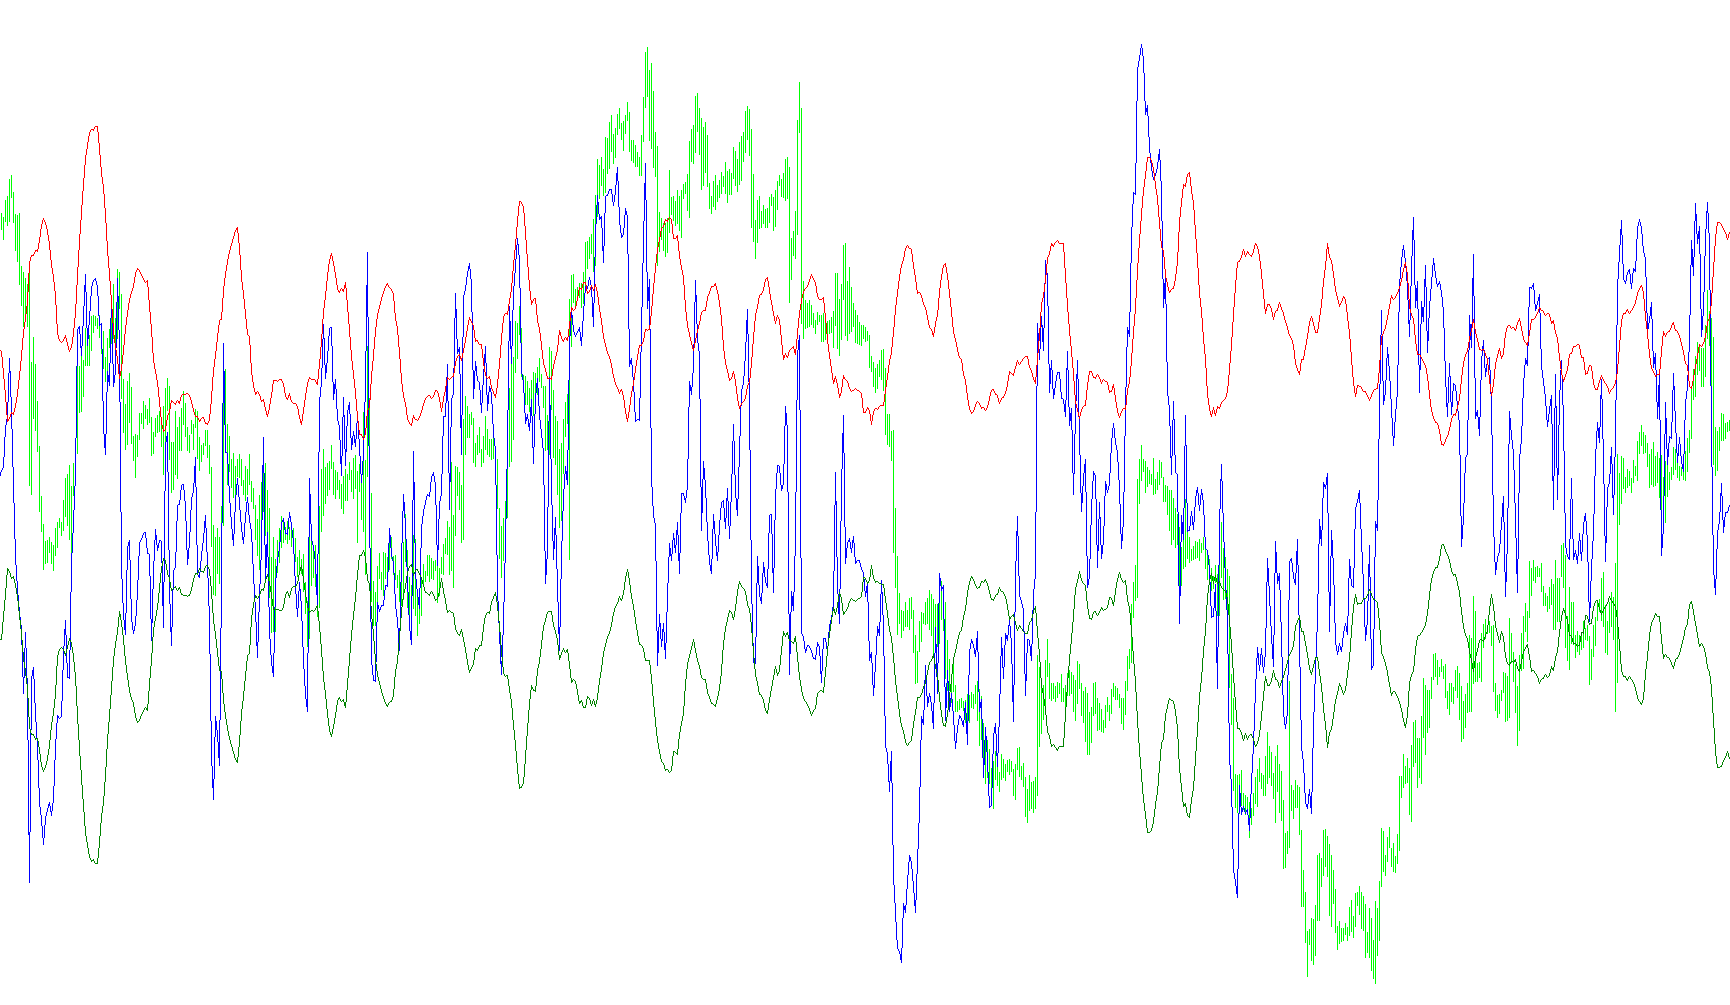
This tool is a dynamic technical analysis indicator designed to enhance the standard Relative Strength Index (RSI). While a traditional RSI provides a fixed set of boundaries to identify "overbought" and "oversold" conditions, this specific script introduces an adaptive mechanism that adjusts those boundaries automatically based on current market volatility.
Core Logic and Functionality
The primary purpose of this indicator is to provide a more flexible way to interpret market extremes. Instead of relying on static horizontal lines, the tool calculates moving boundaries that expand and contract in response to price action.
1. Dual Calculation Methods The script offers two distinct mathematical approaches to determine how these boundaries behave:
- Moving Average Method: This approach looks at the current RSI value and compares it against a smoothed average of previous RSI values. It measures the "gap" or deviation between the real-time data and the average, using that gap to define the range.
- Standard Deviation Method: This approach uses a statistical measure known as Standard Deviation. It calculates how much the RSI is fluctuating compared to its recent history. If the market becomes highly volatile, the boundaries widen; if the market stays calm, the boundaries tighten.
2. Dynamic Boundary Generation By using the methods mentioned above, the indicator creates two shifting lines: an Upper Border (Overbought) and a Lower Border (Oversold).
- The center point remains at 50.
- The distance from 50 to the borders is determined by a user-defined "deviation" multiplier.
- As market conditions change, these borders move up or down, ensuring that the signals for "overbought" or "oversold" remain relevant to the current environment rather than being outdated by sudden spikes or lulls in price.
3. Visual Representation The tool provides a clear visual interface on your chart:
- The RSI Line: Shows the primary momentum of the asset.
- Overbought/Oversold Borders: These act as "dynamic zones." When the RSI line pushes outside these moving boundaries, it suggests that the price may be stretched further than usual for the current market state, potentially signaling a reversal or a period of exhaustion.
Summary for Traders
Essentially, this script solves the problem of "static" indicators. In a fast-moving market, a standard RSI might stay in the overbought zone for a long time while the price continues to climb; by self-adjusting its boundaries based on volatility, this tool seeks to provide a more accurate reflection of what constitutes an "extreme" at any given moment.
//+------------------------------------------------------------------+
//|                                         FX5_SelfAdjustingRSI.mq4 |
//|                                                              FX5 |
//|                                                    hazem@uk2.net |
//+------------------------------------------------------------------+
#property copyright "FX5"
#property link      "hazem@uk2.net"
//----
#property indicator_separate_window
#property indicator_minimum 1
#property indicator_maximum 100
#property indicator_buffers 3
#property indicator_level1  20
#property indicator_level2  50
#property indicator_level3  80
//---- input parameters
extern int    rsiPeriod = 14;
extern double diviation = 2;
extern bool   MA_Method = true;
extern color  rsiColor = Blue;
extern color  overBoughtColor = Red;
extern color  overSoldColor = Green;
//---- buffers
double rsi[];
double upperBorder[];
double lowerBorder[];
double absDiviation[];
//+------------------------------------------------------------------+
//| Custom indicator initialization function                         |
//+------------------------------------------------------------------+
int init()
  {
//---- indicators
   SetIndexStyle(0, DRAW_LINE, EMPTY, EMPTY, rsiColor);
   SetIndexStyle(1, DRAW_LINE, EMPTY, EMPTY, overBoughtColor);
   SetIndexStyle(2, DRAW_LINE, EMPTY, EMPTY, overSoldColor);
//----
   SetIndexBuffer(0, rsi);
   SetIndexBuffer(1, upperBorder);
   SetIndexBuffer(2, lowerBorder);
//----
   SetIndexDrawBegin(0, rsiPeriod);
   SetIndexDrawBegin(1, rsiPeriod * 2);
   SetIndexDrawBegin(2, rsiPeriod * 2);
//----
   SetIndexLabel(0, "RSI");
   SetIndexLabel(1, "OverBought");
   SetIndexLabel(2, "OverSold");
//----
   IndicatorShortName("FX5_SelfAdjustingRSI( " + rsiPeriod + " )");
   IndicatorBuffers(4);
   SetIndexBuffer(3, absDiviation);
//----
   return(0);
  }
//+------------------------------------------------------------------+
//| Custom indicator deinitialization function                       |
//+------------------------------------------------------------------+
int deinit()
  {
   return(0);
  }
//+------------------------------------------------------------------+
//| Custom indicator iteration function                              |
//+------------------------------------------------------------------+
int start()
  {
   int countedBars = IndicatorCounted();
//----
   if(MA_Method == true)
       MovingAverageMethod(countedBars);
   else
       StandardDeviationMethod(countedBars);
//----
   return(0);
  }
//+------------------------------------------------------------------+
//|                                                                  |
//+------------------------------------------------------------------+
void MovingAverageMethod(int countedBars)
  {
   if(countedBars < 0)
      countedBars = 0;
//----
   for(int i = Bars - countedBars; i >= 0; i--)
     {
       rsi[i] = iRSI(NULL, 0, rsiPeriod, PRICE_CLOSE, i);
       double smoothedRSI = GetSmoothedRSI(i);
       absDiviation[i] = MathAbs(rsi[i] - smoothedRSI);
       double kDiviation = diviation * GetAbsDiviationAverage(i);
       upperBorder[i] = 50 + kDiviation;
       lowerBorder[i] = 50 - kDiviation;
     }
  }
//+------------------------------------------------------------------+
//|                                                                  |
//+------------------------------------------------------------------+
void StandardDeviationMethod(int countedBars)
  {
   if(countedBars < 0)
       countedBars = 0;
//----
   for(int i = Bars - countedBars; i >= 0; i--)
     {
       rsi[i] = iRSI(NULL, 0, rsiPeriod, PRICE_CLOSE, i);
       double rsiDiviation = iStdDevOnArray(rsi, 0, rsiPeriod, 0,
                                            MODE_SMA, i);
       double kDiviation = diviation * rsiDiviation;
       upperBorder[i] = 50 + kDiviation;
       lowerBorder[i] = 50 - kDiviation;
     }
  }
//+------------------------------------------------------------------+
//|                                                                  |
//+------------------------------------------------------------------+
double GetSmoothedRSI(int shift)
  {
   double sum = 0;
   for(int i = shift; i < shift + rsiPeriod; i++)
     {
       sum += rsi[i];
     }
   return(sum / rsiPeriod);
  }
//+------------------------------------------------------------------+
//|                                                                  |
//+------------------------------------------------------------------+
double GetAbsDiviationAverage(int shift)
  {
   double sum = 0;
   for(int i = shift; i < shift + rsiPeriod; i++)
     {
       sum += absDiviation[i];
     }
   return(sum / rsiPeriod);
  }
//+------------------------------------------------------------------+
Comments