Extreme_RSI
Download script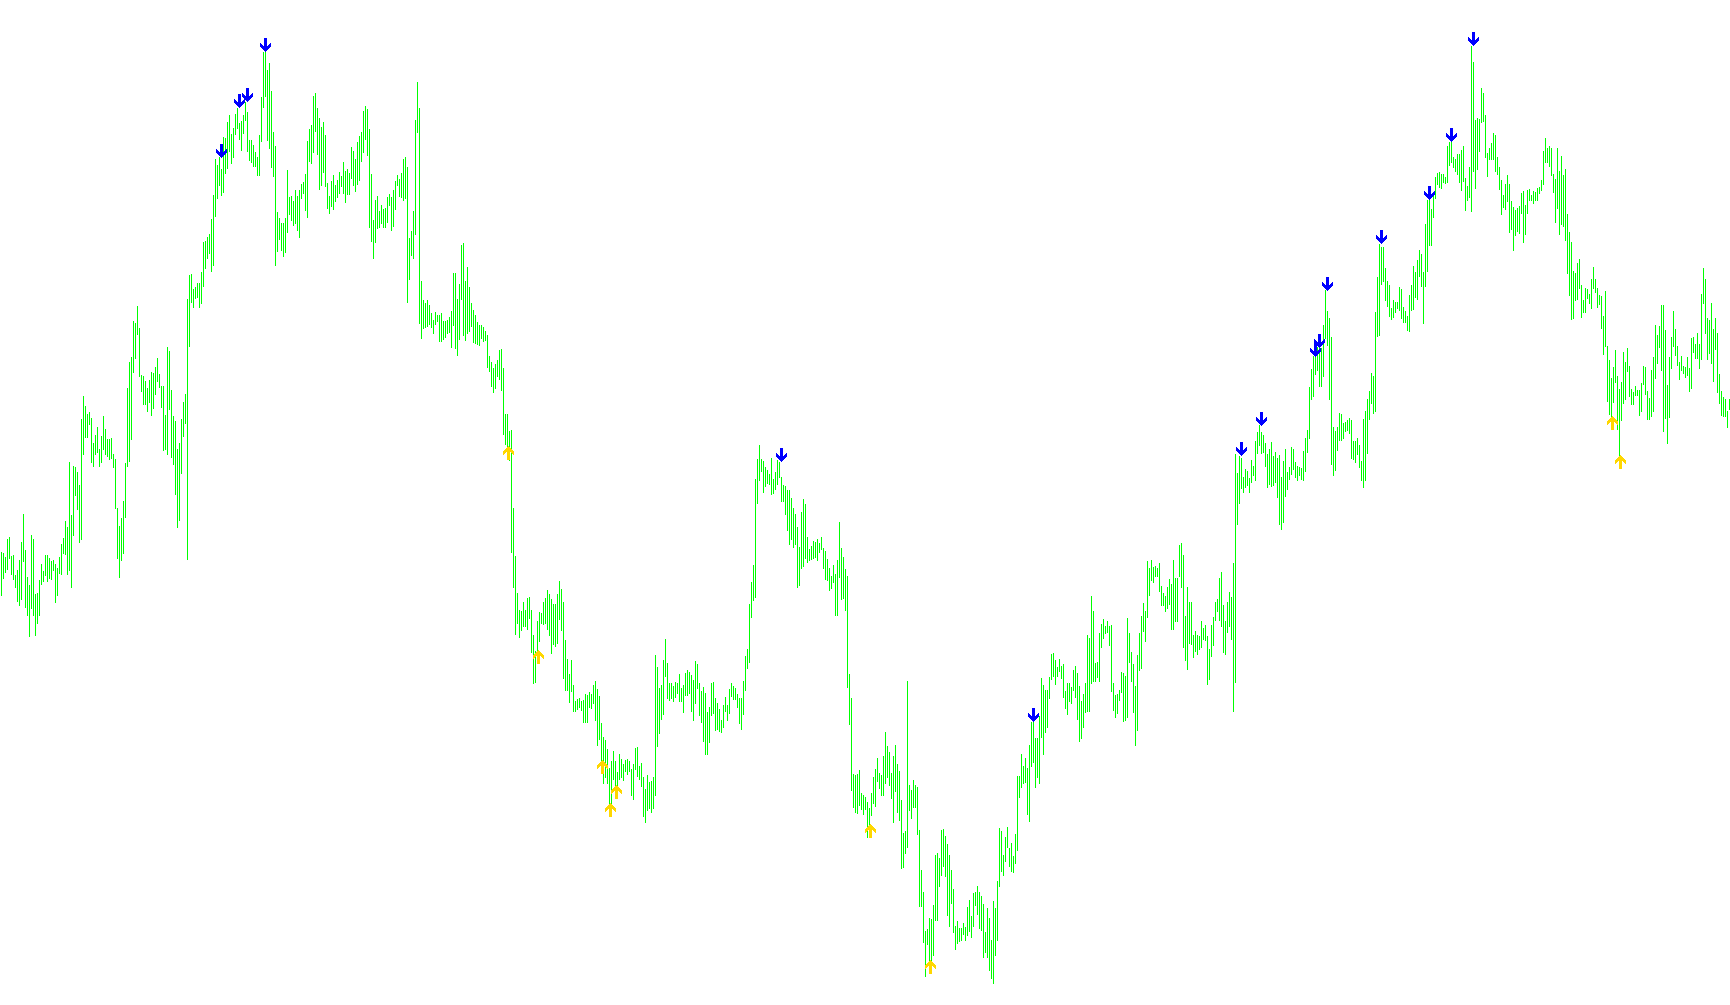
This tool is designed to help traders identify potential turning points in the market by monitoring price momentum. It uses a well-known technical analysis metric called the Relative Strength Index (RSI), which measures whether an asset is being bought or sold with increasing intensity.
How it Works
The script constantly scans the price history of your chosen currency pair or asset. It specifically looks for "extreme" movements—moments where the market price has moved so quickly in one direction that it becomes statistically overextended.
The logic follows two primary rules:
- Identifying Buy Opportunities: The tool watches for moments when the momentum shifts upward from a "low" zone. Specifically, if the momentum indicator was previously below a certain threshold (indicating it might have been undervalued) and then crosses above that line, the script recognizes this as a potential entry point for a long position.
- Identifying Sell Opportunities: Conversely, it monitors the upper boundary of the market's movement. If the momentum drops from a "high" zone (suggesting the asset may have been overbought), the script identifies this as a potential signal to look for a downward move or a short position.
Visual Feedback
Instead of cluttering your screen with complex lines and numbers, the script provides clean visual cues:
- Buy Signals: When a positive momentum shift is detected, a specific arrow appears on the chart below the previous candle.
- Sell Signals: When a negative momentum shift is detected, a corresponding arrow appears above the previous candle.
Key Features
- Real-Time Monitoring: The script is designed to process data as new price bars form, ensuring that signals are updated with the latest market activity.
- Simplified Analysis: By filtering out the "noise" of standard price movements and focusing only on these extreme momentum shifts, it helps traders pinpoint high-probability areas where a trend might be reversing.
- Customizable Sensitivity: The logic allows for a specific timeframe (period) to be set, letting you adjust how quickly or slowly the indicator reacts to market changes based on your trading style.
Indicators Used
Miscellaneous
4
Views
0
Downloads
0
Favorites
Extreme_RSI
//+------------------------------------------------------------------+
//|                                                  rsi extreme.mq4 |
//|                                           Author: LordoftheMoney |
//|                                Expert advisor is in the codebase |
//|                                                    (Easiest RSI) |
//+------------------------------------------------------------------+

#property indicator_chart_window
#property indicator_buffers 2
#property indicator_width1 1
#property indicator_width2 1
#property indicator_color1 DodgerBlue
#property indicator_color2 DodgerBlue
extern int rsiperiod = 14;
double buffy1[];
double buffy2[];
int cb=0;
int bar;
//+------------------------------------------------------------------+
//| Custom indicator initialization function                         |
//+------------------------------------------------------------------+
int init()
  {
   int  draw;
   SetIndexStyle(0,DRAW_ARROW);
   SetIndexArrow(0,233);
   SetIndexStyle(1,DRAW_ARROW);
   SetIndexArrow(1,234);
   SetIndexEmptyValue(0,0.0);
   SetIndexLabel(0,"buy");
   SetIndexLabel(1,"sell");
   SetIndexDrawBegin(0,draw);
   SetIndexDrawBegin(1,draw);
   SetIndexBuffer(0,buffy1);
   SetIndexBuffer(1,buffy2);
   return(0);
  }
//+------------------------------------------------------------------+
int deinit()
  {
   ObjectsDeleteAll(0,OBJ_ARROW);
   return(0);
  }
//+------------------------------------------------------------------+
int start()
  {
   if (bar==Time[0]) return(0);
   int cb=IndicatorCounted();
   int x;
   if(Bars<=100) return(0);
   if (cb<0) return(-1);
   if (cb>0) cb--;
   x=Bars-cb;
   for(int i=0; i<x; i++)
   {
    double r1 = iRSI(NULL,0,rsiperiod,PRICE_CLOSE,i);
    double r2 = iRSI(NULL,0,rsiperiod,PRICE_CLOSE,i+1);
     if (r1>30 && r2<30)
      buffy1[i] = Low[i+1]-15*Point;
     bar=Time[0];
     if (r1<70 && r2>70)
      buffy2[i] = High[i+1]+15*Point;
     bar=Time[0];
   }

   return(0);
  }
//+------------------------------------------------------------------+
Comments