ChandelierStops_v1_v2
Download script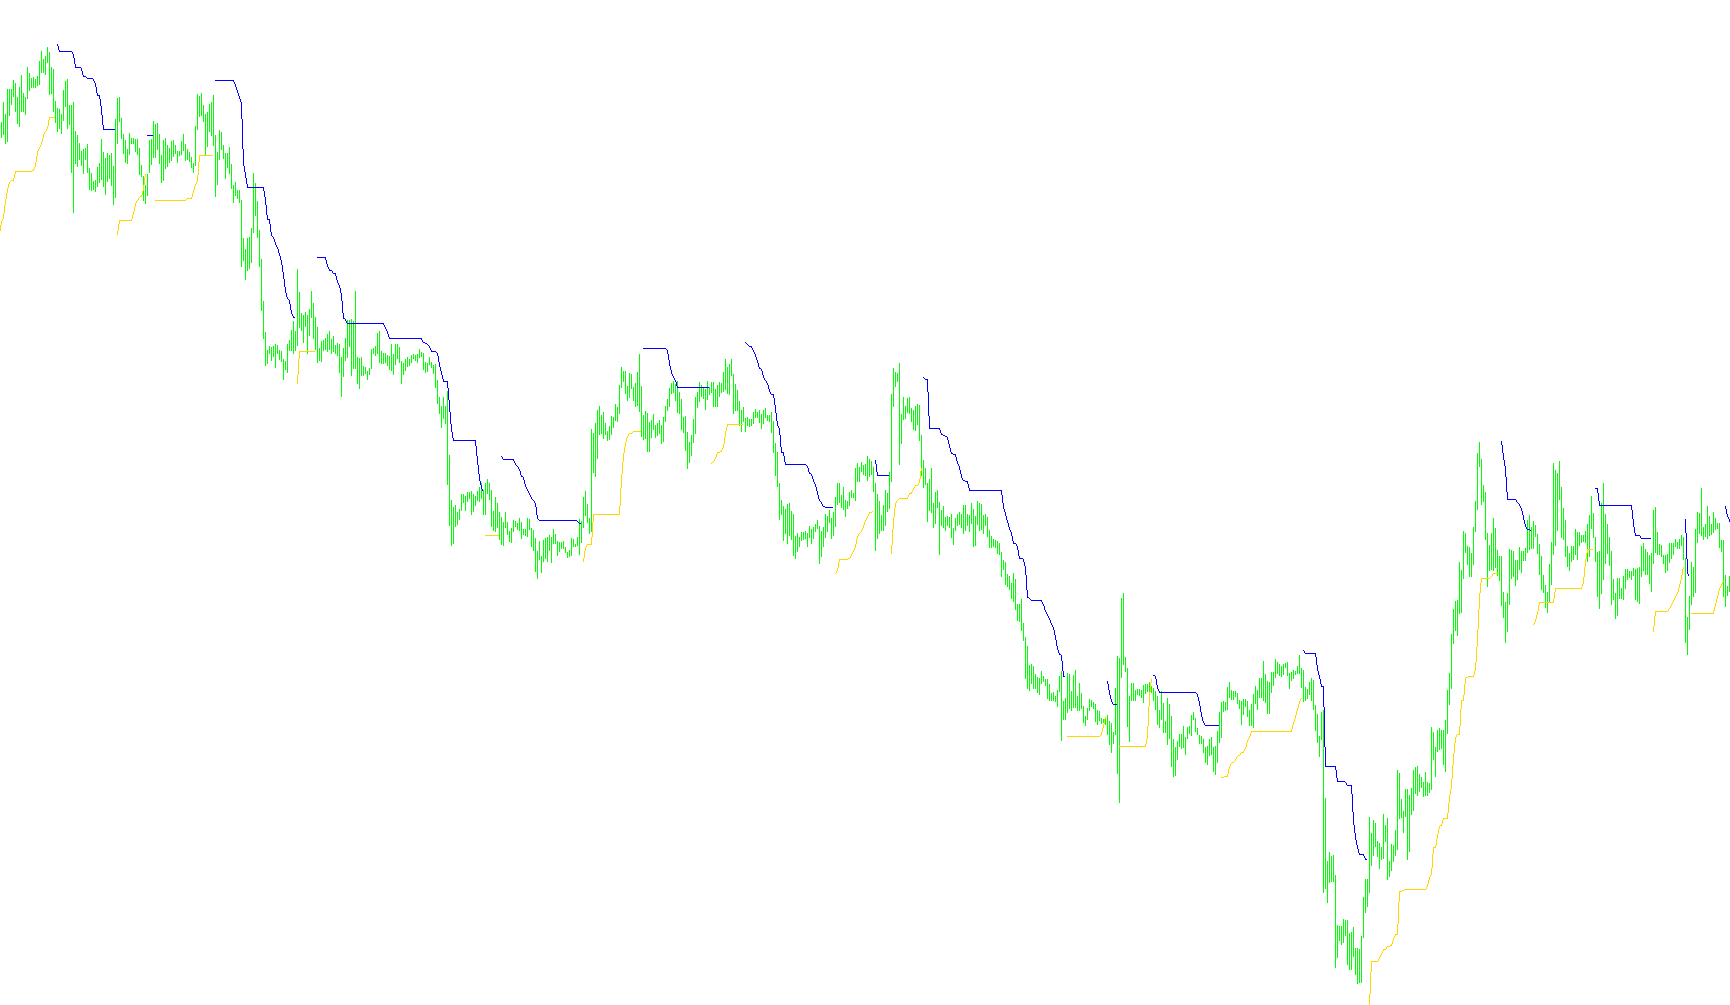
This script is a technical analysis tool designed to help traders visualize market trends and identify potential turning points by plotting two dynamic lines on a price chart. It functions primarily as a "trailing stop" mechanism, which helps determine whether the current market direction is bullish (upward) or bearish (downward).
How the Logic Works
The script calculates its data based on three main components: recent price extremes, market volatility, and current price momentum.
1. Establishing Price Boundaries The tool looks back at a specific number of previous candles (defined by the "Length" setting) to identify the highest highs and the lowest lows reached in that timeframe. From these peaks and valleys, it calculates two theoretical boundaries:
- An upper boundary based on recent lows plus a volatility multiplier.
- A lower boundary based on recent highs minus a volatility multiplier.
2. Measuring Volatility To ensure the lines aren't too sensitive to minor price flickers, the script incorporates an Average True Range (ATR) calculation. This measures how much the market typically moves in a given period. By multiplying this volatility by a user-defined factor (Kv), the tool creates a "buffer zone." This ensures that the trend lines only move when there is a significant, meaningful shift in price, rather than just daily noise.
3. Determining the Trend The script constantly compares the current closing price against the boundaries established in the previous candle:
- Bullish Trend: If the price closes above the upper boundary, the script recognizes an upward trend. It then plots a blue line that acts as a floor, tracking the lowest point of the recent highs to ensure the line only moves up and never down.
- Bearish Trend: If the price closes below the lower boundary, the script recognizes a downward trend. It then plots a red line that acts as a ceiling, tracking the highest point of the recent lows to ensure the line only moves down and never up.
Visual Summary for Traders
When you view this on a chart, the logic results in two distinct lines that follow the price:
- When the market is moving up, you will see a blue line trailing below the price. As long as the price stays above this line, the trend is considered intact.
- When the market shifts downward, the blue line disappears and a red line appears above the price. As long as the price stays below this line, the trend remains bearish.
The primary goal of this logic is to provide a clear visual cue for when a trend has officially "broken," allowing traders to stay with a moving trend until a significant reversal occurs.
//+------------------------------------------------------------------+
//|                                           ChandelierStops_v1.mq4 |
//|                                  Copyright © 2006, Forex-TSD.com |
//|                         Written by IgorAD,igorad2003@yahoo.co.uk |
//|            http://finance.groups.yahoo.com/group/TrendLaboratory |
//+------------------------------------------------------------------+
#property copyright "Copyright © 2006, Forex-TSD.com "
#property link      "http://www.forex-tsd.com/"

#property indicator_chart_window
#property indicator_buffers 2
#property indicator_color1 Blue
#property indicator_color2 Red


//---- input parameters
extern int     Length=15;
extern int     ATRperiod=14;
extern double  Kv=4;
extern int     Shift=1;
//---- indicator buffers
double UpBuffer1[];
double DnBuffer1[];
double smin[];
double smax[];
double trend[];
int lastTrend = 2;
//+------------------------------------------------------------------+
//| Custom indicator initialization function                         |
//+------------------------------------------------------------------+
  int init()
  {
   string short_name;
//---- indicator line
   SetIndexStyle(0,DRAW_LINE);
   SetIndexStyle(1,DRAW_LINE);
   IndicatorBuffers(5);
   SetIndexBuffer(0,UpBuffer1);
   SetIndexBuffer(1,DnBuffer1);
   SetIndexBuffer(2,smin);
   SetIndexBuffer(3,smax);
   SetIndexBuffer(4,trend);
//---- name for DataWindow and indicator subwindow label
   short_name="ATRStops("+Length+")";
   IndicatorShortName(short_name);
   SetIndexLabel(0,"Up");
   SetIndexLabel(1,"Dn");
//----
   SetIndexDrawBegin(0,Length);
   SetIndexDrawBegin(1,Length);
//----
   return(0);
  }

//+------------------------------------------------------------------+
//| ChandelierStops_v1                                                     |
//+------------------------------------------------------------------+
int start()
  {

   int shift,limit, counted_bars=IndicatorCounted();

   if ( counted_bars > 0 )  limit=Bars-counted_bars;
   if ( counted_bars < 0 )  return(0);
   if ( counted_bars ==0 )  limit=Bars-Length-1;
   int curTrend;
	for(shift=limit;shift>=0;shift--)
   {
   smin[shift] = High[Highest(NULL,0,MODE_HIGH,Length,shift+Shift)] - Kv*iATR(NULL,0,ATRperiod,shift+Shift);
	smax[shift] = Low[Lowest(NULL,0,MODE_LOW,Length,shift+Shift)] + Kv*iATR(NULL,0,ATRperiod,shift+Shift);

	  trend[shift]=trend[shift+1];
	  if ( Close[shift] > smax[shift+1] ) trend[shift] =  1;
	  if ( Close[shift] < smin[shift+1] ) trend[shift] = -1;
	  curTrend = trend[shift];
	  if ( trend[shift] >0 )
	  {
	  if( smin[shift]<smin[shift+1] ) smin[shift]=smin[shift+1];
	  UpBuffer1[shift]=smin[shift];
	  DnBuffer1[shift] = EMPTY_VALUE;
	  }
	  if ( trend[shift] <0 )
	  {
	  if( smax[shift]>smax[shift+1] ) smax[shift]=smax[shift+1];
	  UpBuffer1[shift]=EMPTY_VALUE;
	  DnBuffer1[shift] = smax[shift];
	  }
	}
	lastTrend=curTrend;
	return(0);
 }
Comments