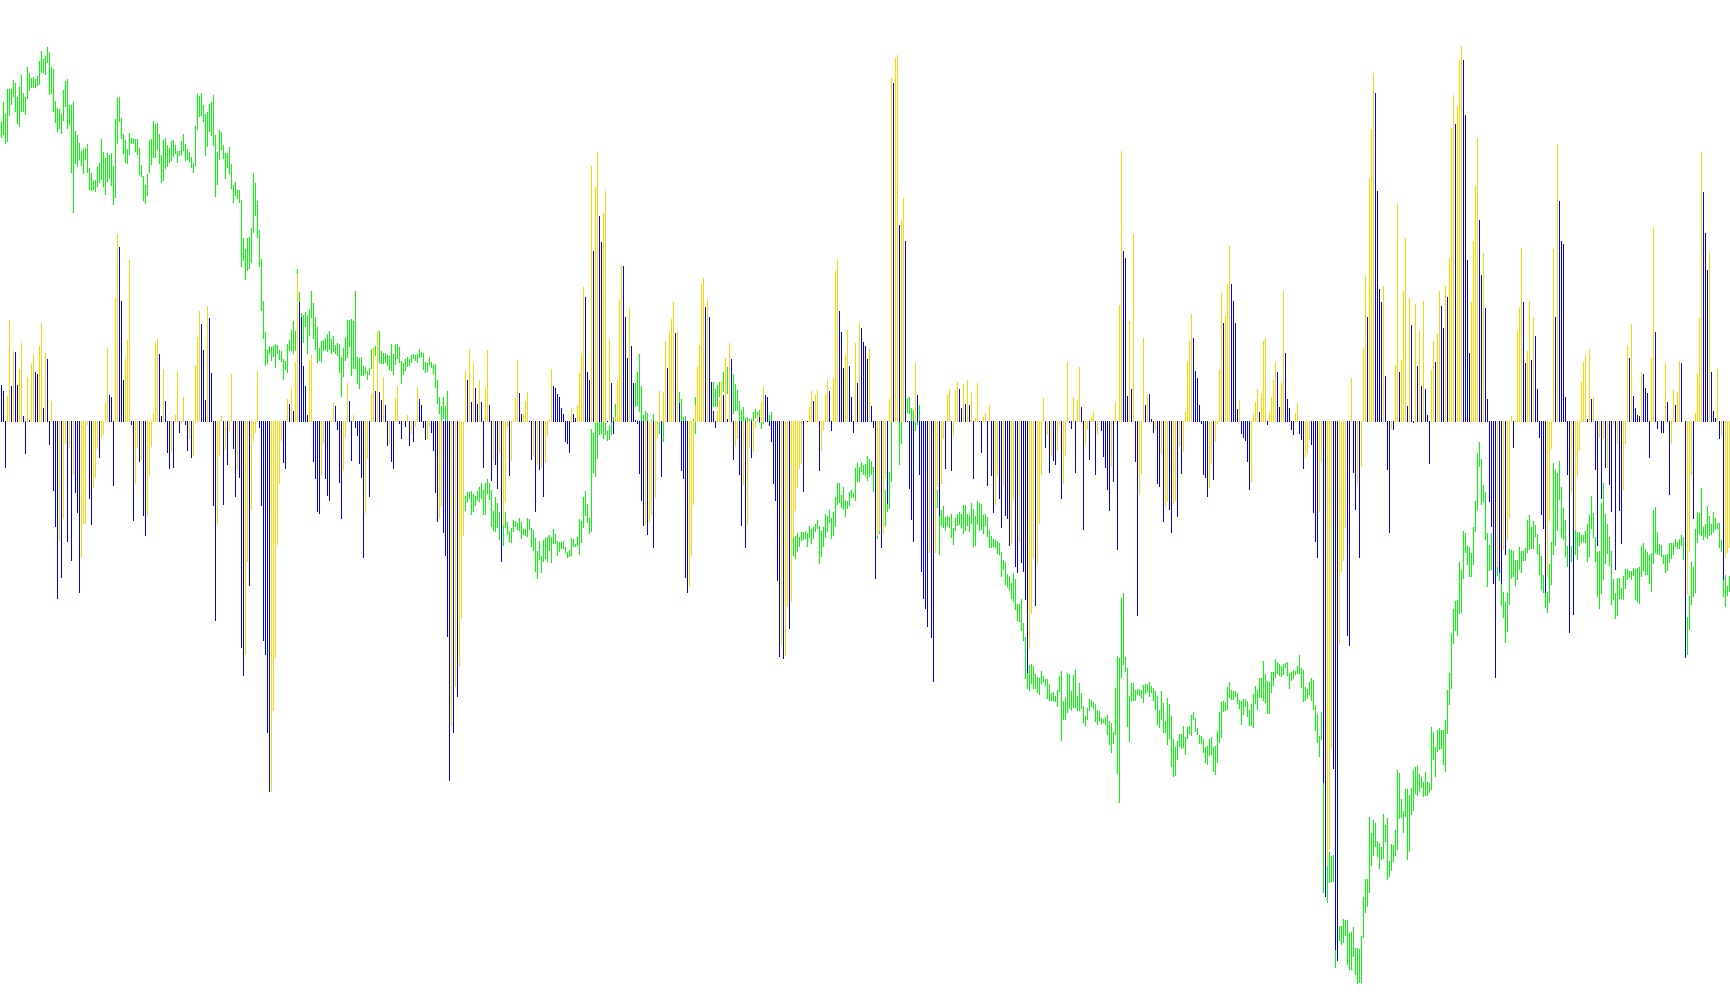
The ChandeQStick indicator is a technical analysis tool designed to help traders visualize price momentum and identify the direction of market trends. By analyzing the relationship between opening and closing prices over a specific timeframe, it provides a visual representation of whether the current market sentiment is leaning toward bullish (upward) or bearish (downward) momentum.
How the Logic Works
1. Measuring Price Movement (The Difference) Instead of looking at raw price values, the script first calculates the "net movement" for every individual candle on your chart. It does this by subtracting the opening price from the closing price. This tells the tool how much the price moved during that specific period, regardless of where the price actually sits on the overall scale.
2. Smoothing the Data (The Moving Average) To prevent the indicator from reacting too wildly to minor, insignificant fluctuations (market "noise"), the script applies a moving average to those net movements. Users can choose different types of smoothing (such as Simple, Exponential, Smoothed, or Linear Weighted) to determine how much historical data should influence the current reading. This ensures that the trend shown is consistent and reliable rather than jittery.
3. Identifying Trend Direction (The Sticks) The core logic of the indicator lies in comparing the smoothed movement of the current candle to the movement of the previous candle:
- Bullish Momentum: If the current smoothed value is higher than the previous one, the tool identifies this as upward momentum and displays a "Up" signal.
- Bearish Momentum: If the current smoothed value is lower than the previous one, the tool identifies this as downward momentum and displays a "Down" signal.
Visual Representation
The indicator appears in a separate window below your main price chart as a histogram of vertical sticks:
- One set of sticks represents the Upward momentum.
- The other set represents the Downward momentum.
By observing these shifts, traders can more easily identify when a trend is gaining strength or when it might be starting to lose steam, allowing for clearer decision-making in volatile market conditions.
//+------------------------------------------------------------------+
//|                                              ChandeQStick_v1.mq4 |
//|                           Copyright © 2006, TrendLaboratory Ltd. |
//|            http://finance.groups.yahoo.com/group/TrendLaboratory |
//|                                       E-mail: igorad2004@list.ru |
//+------------------------------------------------------------------+
#property copyright "Copyright © 2006, TrendLaboratory Ltd."
#property link      "http://finance.groups.yahoo.com/group/TrendLaboratory"

#property indicator_separate_window
#property indicator_buffers   2
#property indicator_color1    LightBlue
#property indicator_color2    Orange
#property indicator_width1    3
#property indicator_width2    3
#property indicator_level1    0

//---- input parameters
extern int       Length   =  8; // Period of evaluation
extern int       MA_Mode  =  0; // MA mode : 0-SMA,1-EMA,2-SMMA,3-LWMA

//---- buffers
double CQS_Up[];
double CQS_Dn[];
double Diff[];
double CQS[];
//+------------------------------------------------------------------+
//| Custom indicator initialization function                         |
//+------------------------------------------------------------------+
int init()
  {
//---- indicators
   IndicatorBuffers(4);
   SetIndexStyle(0,DRAW_HISTOGRAM);
   SetIndexBuffer(0,CQS_Up);
   SetIndexStyle(1,DRAW_HISTOGRAM);
   SetIndexBuffer(1,CQS_Dn);
   SetIndexBuffer(2,Diff);
   SetIndexBuffer(3,CQS);
//---- name for DataWindow and indicator subwindow label
   string short_name="ChandeQStick("+Length+","+MA_Mode+")";
   IndicatorShortName(short_name);
   SetIndexLabel(0,"CQS Up");
   SetIndexLabel(0,"CQS Down");
//----
   SetIndexDrawBegin(0,Length);
   SetIndexDrawBegin(1,Length);
   return(0);
  }

//+------------------------------------------------------------------+
//| Custom indicator iteration function                              |
//+------------------------------------------------------------------+
int start()
  {
   int      shift, limit, counted_bars=IndicatorCounted();
   //----
   /*
   if ( counted_bars < 0 ) return(-1);
   if ( counted_bars ==0 ) limit=Bars-Length-1;
   if ( counted_bars < 1 )
   for(int i=1;i<Length;i++)
   {
   CQS_Up[Bars-i]=0;
   CQS_Dn[Bars-i]=0;
   CQS[Bars-i]=0;
   Diff[Bars-i]=0;
   }

   if(counted_bars>0) limit=Bars-counted_bars;
   */
   //---- last counted bar will be recounted
   if(counted_bars>0) counted_bars--;
   limit=Bars-counted_bars;

   for( shift=limit; shift>=0; shift--)
   Diff[shift] = Close[shift]-Open[shift];

   for( shift=limit; shift>=0; shift--)
   {
   CQS[shift] = iMAOnArray(Diff,0,Length,0,MA_Mode,shift);
      if (CQS[shift]>=CQS[shift+1]) {CQS_Up[shift]=CQS[shift];CQS_Dn[shift]=0;}
      else
      if (CQS[shift]<CQS[shift+1]) {CQS_Dn[shift]=CQS[shift];CQS_Up[shift]=0;}
   }
//----
   return(0);
  }
//+------------------------------------------------------------------+
Comments