Chande_Kroll_Stop_v1
Download script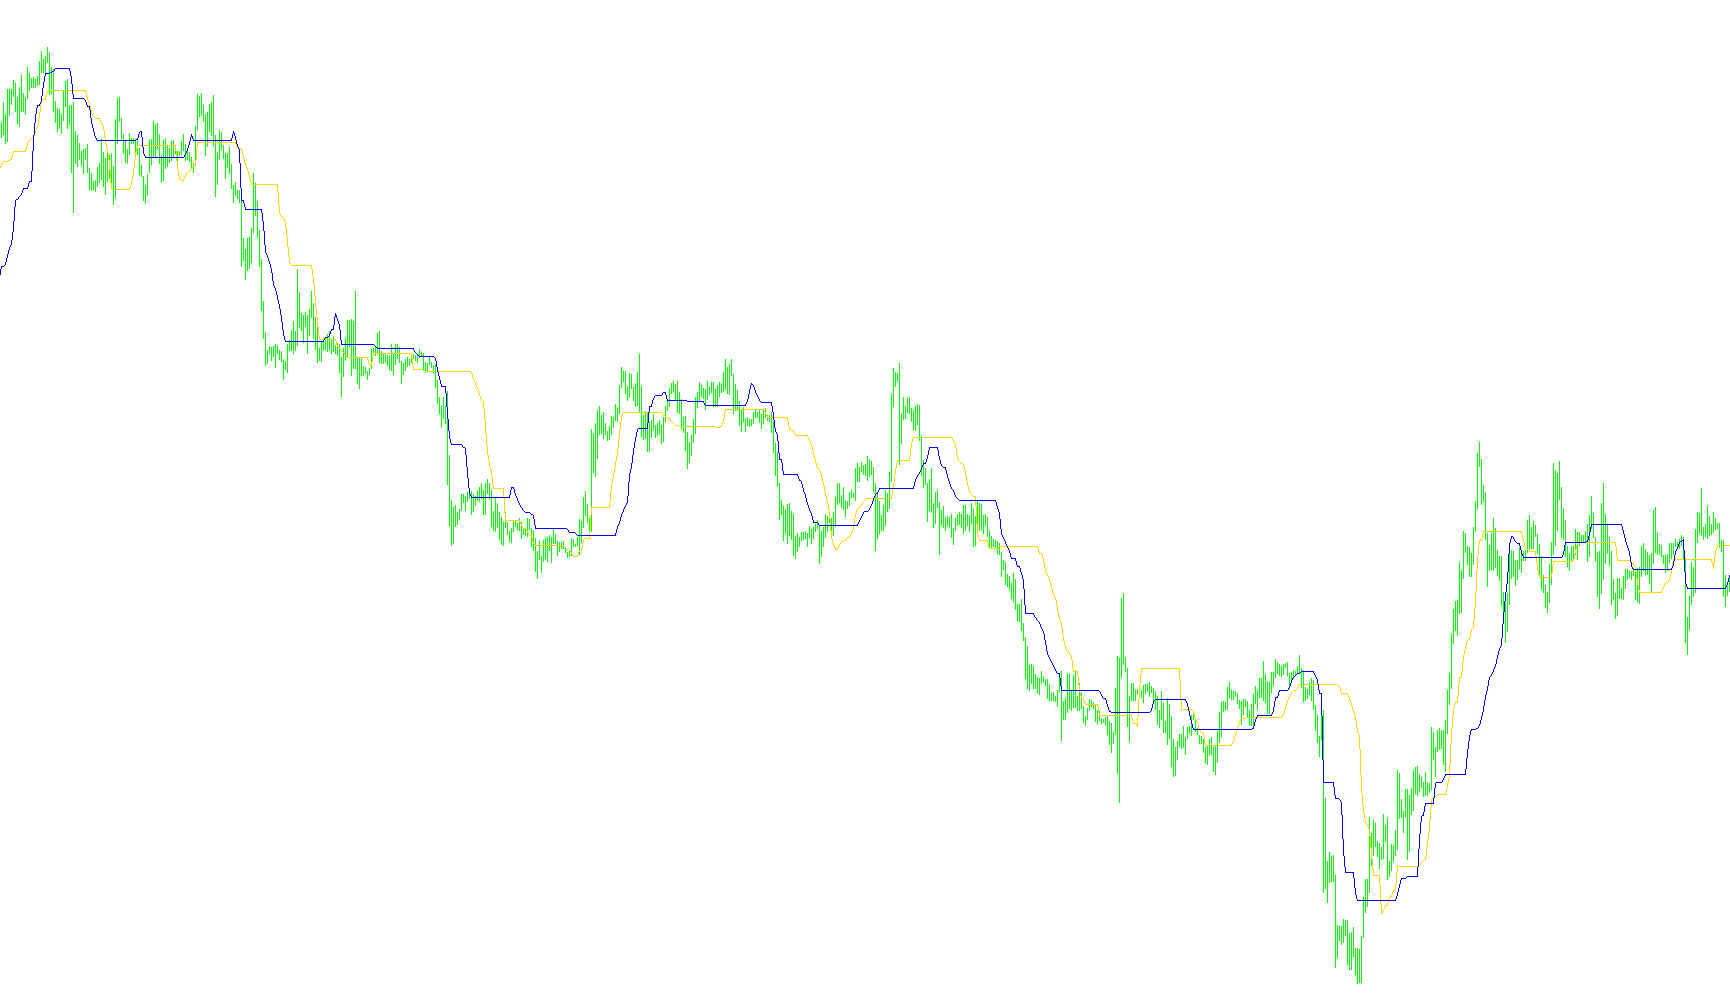
This tool is designed to help traders visualize market trends and identify potential price ceilings and floors by plotting dynamic "stop" levels on a trading chart. Rather than using simple moving averages, it combines several different mathematical perspectives to create a more reactive boundary that adapts to the market's current volatility.
How the Logic Works
The script operates by analyzing three primary components of price action:
1. Volatility and Peak Detection The tool first looks at recent price history to identify the highest highs and lowest lows over a specific timeframe. It then factors in "volatility"—how much the price is swinging back and forth. By combining these extremes with a volatility multiplier, the script calculates a baseline for where the market's "floor" (support) and "ceiling" (resistance) might be located at any given moment.
2. Dynamic Boundary Calculation Instead of just showing a single line, the logic creates two distinct price boundaries:
- The Upside Boundary: This tracks the highest of the calculated "floors" over a set period. It helps identify the strongest level of support the market has recently shown.
- The Downside Boundary: This tracks the lowest of the calculated "ceilings" over a set period. It helps identify the most significant level of resistance the market has encountered.
3. Trend Visualization The script translates these complex calculations into two visual lines on your chart:
- UpTrend Line: This represents the structural support of the market. When the price moves above this, it often signals a bullish environment.
- DnTrend Line: This represents the structural resistance of the market. When the price remains below this, it suggests a bearish sentiment.
Key Purpose for the Trader
The core logic is built to filter out "market noise." By looking at a range of previous highs and lows rather than just the most recent candle, the indicator provides a smoother, more reliable picture of the trend. It allows traders to see where the market is likely to "stop" or react, providing a clearer visual guide for determining whether the current momentum is leaning toward the upside or the downside.
//+------------------------------------------------------------------+
//|                                         Chande_Kroll_Stop_v1.mq4 |
//|                                  Copyright © 2006, Forex-TSD.com |
//|                         Written by IgorAD,igorad2003@yahoo.co.uk |
//|            http://finance.groups.yahoo.com/group/TrendLaboratory |
//+------------------------------------------------------------------+
#property copyright "Copyright © 2006, Forex-TSD.com "
#property link      "http://www.forex-tsd.com/"

#property indicator_chart_window
#property indicator_buffers 2
#property indicator_color1 Blue
#property indicator_color2 Red


//---- input parameters
extern int    Length    =20;
extern int    ATRPeriod =10;
extern double Kv        = 3;

//---- indicator buffers
double UpTrend[];
double DnTrend[];
double smin[];
double smax[];
//+------------------------------------------------------------------+
//| Custom indicator initialization function                         |
//+------------------------------------------------------------------+
  int init()
  {
   string short_name;
//---- indicator line
   SetIndexStyle(0,DRAW_LINE);
   SetIndexStyle(1,DRAW_LINE);
   IndicatorBuffers(4);
   SetIndexBuffer(0,UpTrend);
   SetIndexBuffer(1,DnTrend);
   SetIndexBuffer(2,smin);
   SetIndexBuffer(3,smax);
//---- name for DataWindow and indicator subwindow label
   short_name="Chande Kroll Stop("+Length+","+ATRPeriod+","+Kv+")";
   IndicatorShortName(short_name);
   SetIndexLabel(0,"UpTrend");
   SetIndexLabel(1,"DnTrend");
//----
   SetIndexDrawBegin(0,Length);
   SetIndexDrawBegin(1,Length);
//----
   return(0);
  }

//+------------------------------------------------------------------+
//| Chande_Kroll_Stop_v1                                             |
//+------------------------------------------------------------------+
int start()
  {

   int shift,limit, counted_bars=IndicatorCounted();

   if ( counted_bars > 0 )  limit=Bars-counted_bars;
   if ( counted_bars < 0 )  return(0);
   if ( counted_bars ==0 )  limit=Bars-Length-1;

	for(shift=limit;shift>=0;shift--)
   {
   smin[shift]=High[Highest(NULL,0,MODE_HIGH,ATRPeriod,shift)] - Kv*iATR(NULL,0,ATRPeriod,shift);
   smax[shift]=Low [Lowest (NULL,0,MODE_LOW ,ATRPeriod,shift)] + Kv*iATR(NULL,0,ATRPeriod,shift);

   UpTrend[shift] = -10000000;
   DnTrend[shift] =  10000000;

      for (int i = Length-1;i>=0;i--)
      {
      UpTrend[shift] = MathMax( UpTrend[shift], smin[shift+i]);
      DnTrend[shift] = MathMin( DnTrend[shift], smax[shift+i]);
      }
   }
	return(0);
 }
Comments