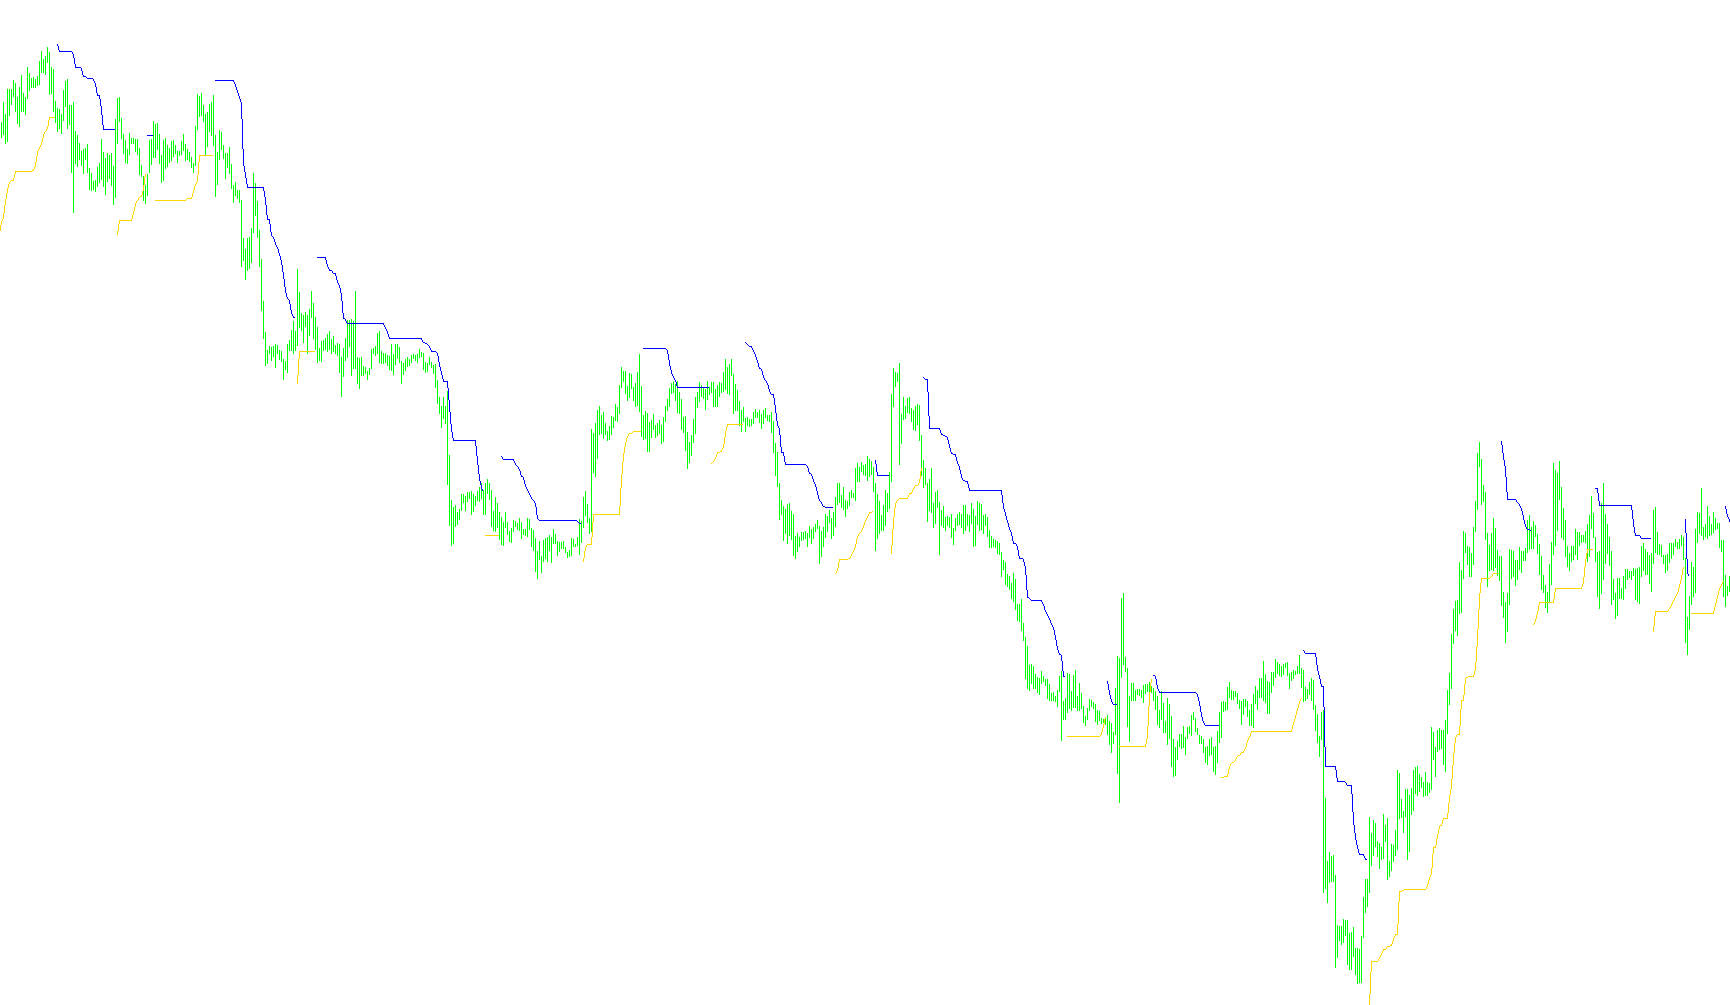
The Chandelier Stops indicator is a sophisticated technical analysis tool designed to identify market trends and provide dynamic "stop-loss" levels for traders. Instead of using fixed prices, it calculates price boundaries based on historical volatility and price extremes, making it highly adaptable to different market conditions.
Core Logic and Functionality
The script operates by analyzing the relationship between current price action and past market behavior. Here is a breakdown of how it functions:
1. Volatility Measurement (ATR) The foundation of this indicator is the Average True Range (ATR). The ATR measures how much an asset typically moves over a specific period. By incorporating this, the script ensures that the "stops" it creates are wider during periods of high market turbulence and tighter during calm markets.
2. Price Extreme Tracking The logic looks back at a user-defined number of recent candles to identify the highest highs and lowest lows.
- For an Upward Trend, it calculates a floor based on the recent highest price minus a multiplier of the volatility.
- For a Downward Trend, it calculates a ceiling based on the recent lowest price plus a multiplier of the volatility.
3. Trend Detection & Switching The indicator tracks the "momentum" of the market by comparing the current closing price to these calculated boundaries:
- Bullish Shift: If the market price closes above the upper boundary, the logic identifies an upward trend.
- Bearish Shift: If the market price closes below the lower boundary, the logic identifies a downward trend.
4. Dynamic Trailing Logic A key feature of this script is its "non-retroactive" trailing logic. In an uptrend, the indicator follows the price from below; however, it is programmed to never move downward. If the calculated floor drops lower than the previous level, the indicator holds at the higher level. This ensures that as a trend continues, the protective stop line only moves in your favor (higher during an uptrend, lower during a downtrend), effectively "locking in" profits while allowing for market fluctuations.
Visual Representation
On your chart, this results in two distinct lines:
- The Upper Line (Red): Represents the ceiling during a downtrend. It trails the price downward as the market falls, providing a visual cue of where the bearish momentum might be exhausted.
- The Lower Line (Blue): Represents the floor during an uptrend. It trails the price upward as the market climbs, serving as a trailing support level for long positions.
By utilizing both historical extremes and real-time volatility, this script provides a sophisticated way to visualize trend direction and identify potential reversal points before they fully materialize.
//+------------------------------------------------------------------+
//|                                           ChandelierStops_v1.mq4 |
//|                                  Copyright © 2006, Forex-TSD.com |
//|                         Written by IgorAD,igorad2003@yahoo.co.uk |
//|            http://finance.groups.yahoo.com/group/TrendLaboratory |
//+------------------------------------------------------------------+
#property copyright "Copyright © 2006, Forex-TSD.com "
#property link      "http://www.forex-tsd.com/"
//----
#property indicator_chart_window
#property indicator_buffers 2
#property indicator_color1 Blue
#property indicator_color2 Red
//---- input parameters
extern int     Length=15;
extern int     ATRperiod=14;
extern double  Kv=4;
extern int     Shift=1;
//---- indicator buffers
double UpBuffer1[];
double DnBuffer1[];
double smin[];
double smax[];
double trend[];
//+------------------------------------------------------------------+
//| Custom indicator initialization function                         |
//+------------------------------------------------------------------+
  int init()
  {
   string short_name;
//---- indicator line
   SetIndexStyle(0,DRAW_LINE);
   SetIndexStyle(1,DRAW_LINE);
   IndicatorBuffers(5);
   SetIndexBuffer(0,UpBuffer1);
   SetIndexBuffer(1,DnBuffer1);
   SetIndexBuffer(2,smin);
   SetIndexBuffer(3,smax);
   SetIndexBuffer(4,trend);
//---- name for DataWindow and indicator subwindow label
   short_name="ATRStops("+Length+")";
   IndicatorShortName(short_name);
   SetIndexLabel(0,"Up");
   SetIndexLabel(1,"Dn");
//----
   SetIndexDrawBegin(0,Length);
   SetIndexDrawBegin(1,Length);
//----
   return(0);
  }
//+------------------------------------------------------------------+
//| ChandelierStops_v1                                               |
//+------------------------------------------------------------------+
int start()
  {
   int shift,limit, counted_bars=IndicatorCounted();
//----
   if(counted_bars > 0) limit=Bars-counted_bars;
   if(counted_bars < 0) return(0);
   if(counted_bars ==0) limit=Bars-Length-1;
//----
   for(shift=limit;shift>=0;shift--)
     {
      smin[shift]=High[Highest(NULL,0,MODE_HIGH,Length,shift+Shift)] - Kv*iATR(NULL,0,ATRperiod,shift+Shift);
      smax[shift]=Low[Lowest(NULL,0,MODE_LOW,Length,shift+Shift)] + Kv*iATR(NULL,0,ATRperiod,shift+Shift);
      trend[shift]=trend[shift+1];
//----
      if(Close[shift] > smax[shift+1])trend[shift]= 1;
      if(Close[shift] < smin[shift+1])trend[shift]=-1;
      if(trend[shift] >0)
        {
         if(smin[shift]<smin[shift+1])smin[shift]=smin[shift+1];
         UpBuffer1[shift]=smin[shift];
         DnBuffer1[shift]=EMPTY_VALUE;
        }
      if(trend[shift] <0)
        {
         if(smax[shift]>smax[shift+1])smax[shift]=smax[shift+1];
         UpBuffer1[shift]=EMPTY_VALUE;
         DnBuffer1[shift]=smax[shift];
        }
     }
   return(0);
  }
//+------------------------------------------------------------------+
Comments