Circles_for_fun
Download script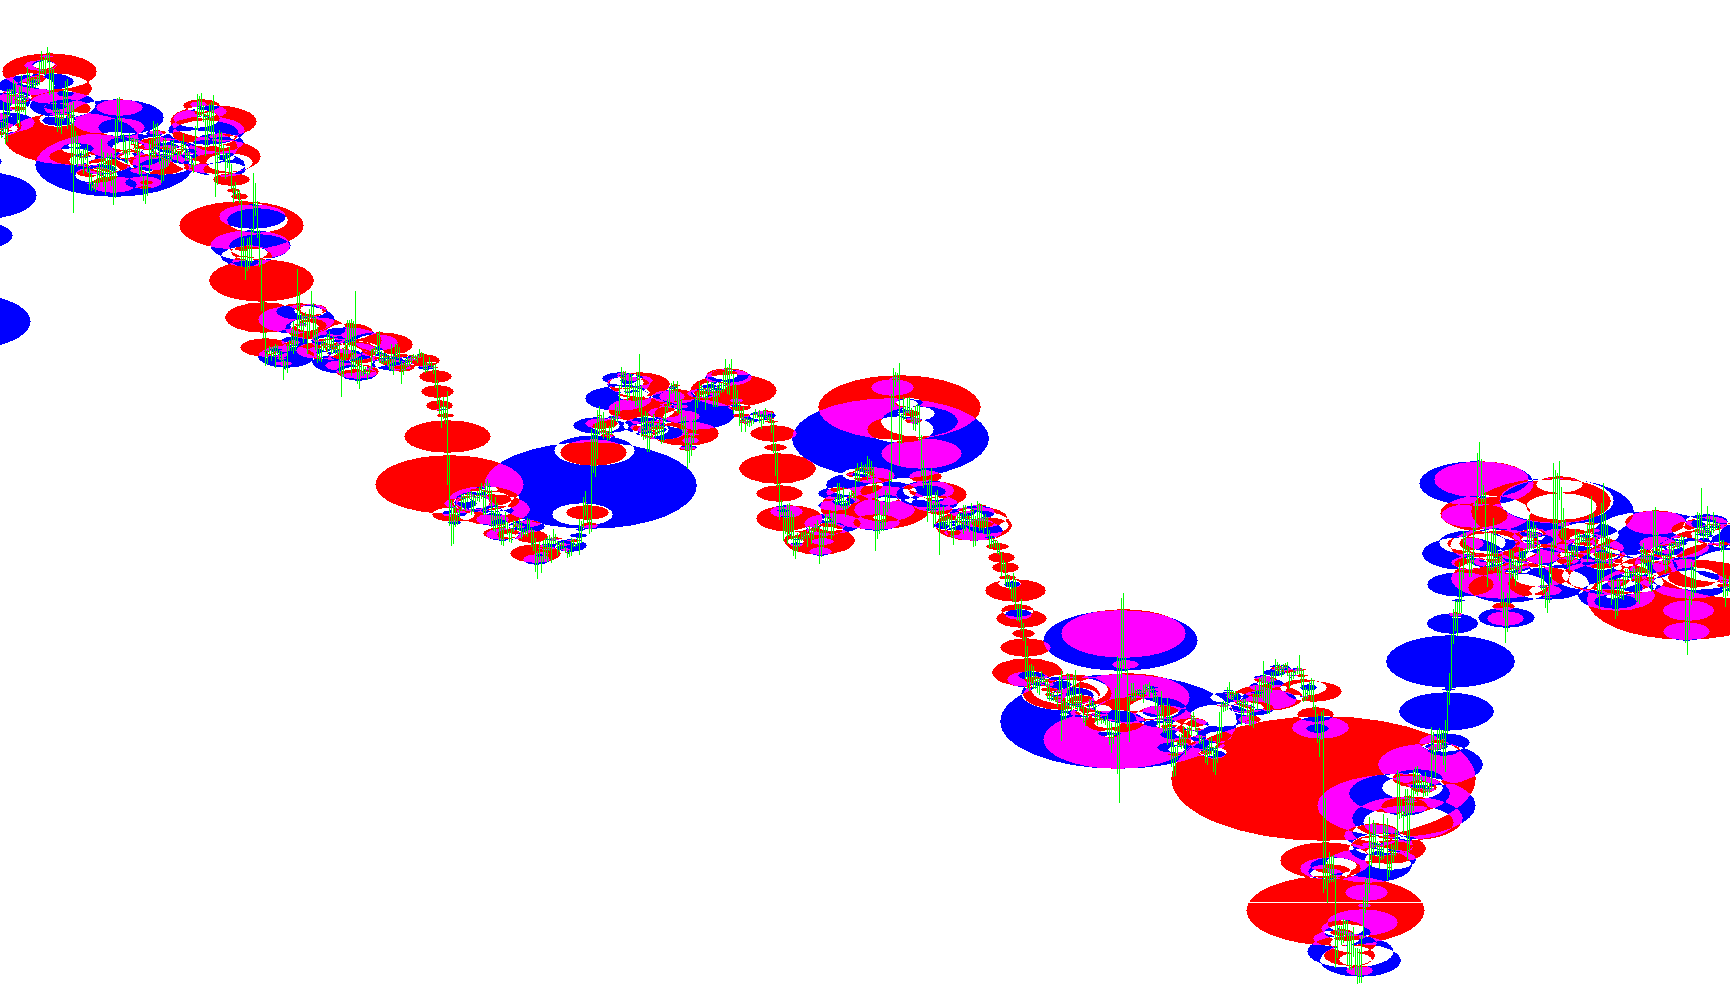
This script is a visual tool designed to enhance the readability of price action on a trading chart by automatically drawing geometric shapes over specific candles. Instead of simply looking at standard bars or lines, this indicator provides a clear visual cue regarding market movement for every candle it processes.
Core Functionality
The primary purpose of this script is to identify whether a candle closed higher or lower than its starting price and then mark that movement with a colored circle (ellipse). It translates raw price data into a more intuitive visual map, allowing traders to quickly scan historical data to see the direction of price flow.
How it Works
The logic operates based on the following steps:
- Price Comparison: The script examines each candle on your chart to compare its opening price with its closing price.
- Visual Identification:
- If a candle closes higher than it opened (a bullish move), the script identifies this and applies a specific color (Blue by default).
- If a candle closes lower than it opened (a bearish move), the script applies a different color (Red by default).
- Dynamic Scaling: Each shape is adjusted using a scale factor, ensuring that the circles appear proportional to the chart's layout rather than overlapping excessively or appearing too small to see.
- Customizable Coverage: The user has the flexibility to decide how much history they want to visualize. You can set it to analyze every single candle available on the chart or limit it to a specific number of recent bars.
User Experience
When applied to a chart, this tool cleans up the visual experience by highlighting "winning" and "losing" candles with distinct colored markers. This helps in identifying trends, clusters of price action, and momentum shifts at a single glance, making it easier to interpret market behavior without having to manually calculate individual candle movements.
//+------------------------------------------------------------------+
//|                                              Circles_for_fun.mq4 |
//|                                                         Zen_Leow |
//|                                                                  |
//+------------------------------------------------------------------+
#property copyright "Zen_Leow"
#property link      ""

#property indicator_chart_window

extern int    NumberOfBars   = 0; // means do all
extern double Scale_Factor    = 0.05;
extern color  UpCircle       = Blue;
extern color  DownCircle     = Red;

//+------------------------------------------------------------------+
//| Custom indicator initialization function                         |
//+------------------------------------------------------------------+
int init()
{
//---- indicators
//----
   return(0);
}
//+------------------------------------------------------------------+
//| Custom indicator deinitialization function                       |
//+------------------------------------------------------------------+
int deinit()
{
//----
   ObjectsDeleteAll();
//----
   return(0);
}
//+------------------------------------------------------------------+
//| Custom indicator iteration function                              |
//+------------------------------------------------------------------+
int start()
{
   int limit;
   int counted_bars=IndicatorCounted();
//---- last counted bar will be recounted
   if(counted_bars>0) counted_bars--;
   limit=Bars-counted_bars;

   if (NumberOfBars <= 0)
   {
      for(int i=0; i<limit;i++)
      {
         ObjectCreate("ellipse"+Time[i],OBJ_ELLIPSE,0,Time[i],Open[i],Time[i],Close[i]);
         ObjectSet("ellipse"+Time[i],OBJPROP_SCALE,Scale_Factor);
         if (Close[i] > Open[i])
         {
            ObjectSet("ellipse"+Time[i],OBJPROP_COLOR,UpCircle);
         }
         else
         {
            ObjectSet("ellipse"+Time[i],OBJPROP_COLOR,DownCircle);
         }
      }
   }
   else
   {
      ObjectsDeleteAll();
      for(i=0; i<NumberOfBars;i++)
      {
         ObjectCreate("ellipse"+Time[i],OBJ_ELLIPSE,0,Time[i],Open[i],Time[i],Close[i]);
         ObjectSet("ellipse"+Time[i],OBJPROP_SCALE,Scale_Factor);
         if (Close[i] > Open[i])
         {
            ObjectSet("ellipse"+Time[i],OBJPROP_COLOR,UpCircle);
         }
         else
         {
            ObjectSet("ellipse"+Time[i],OBJPROP_COLOR,DownCircle);
         }
      }
   }
//---- done
   return(0);
}
//+------------------------------------------------------------------+
Comments