Center_of_Gravityind
Download script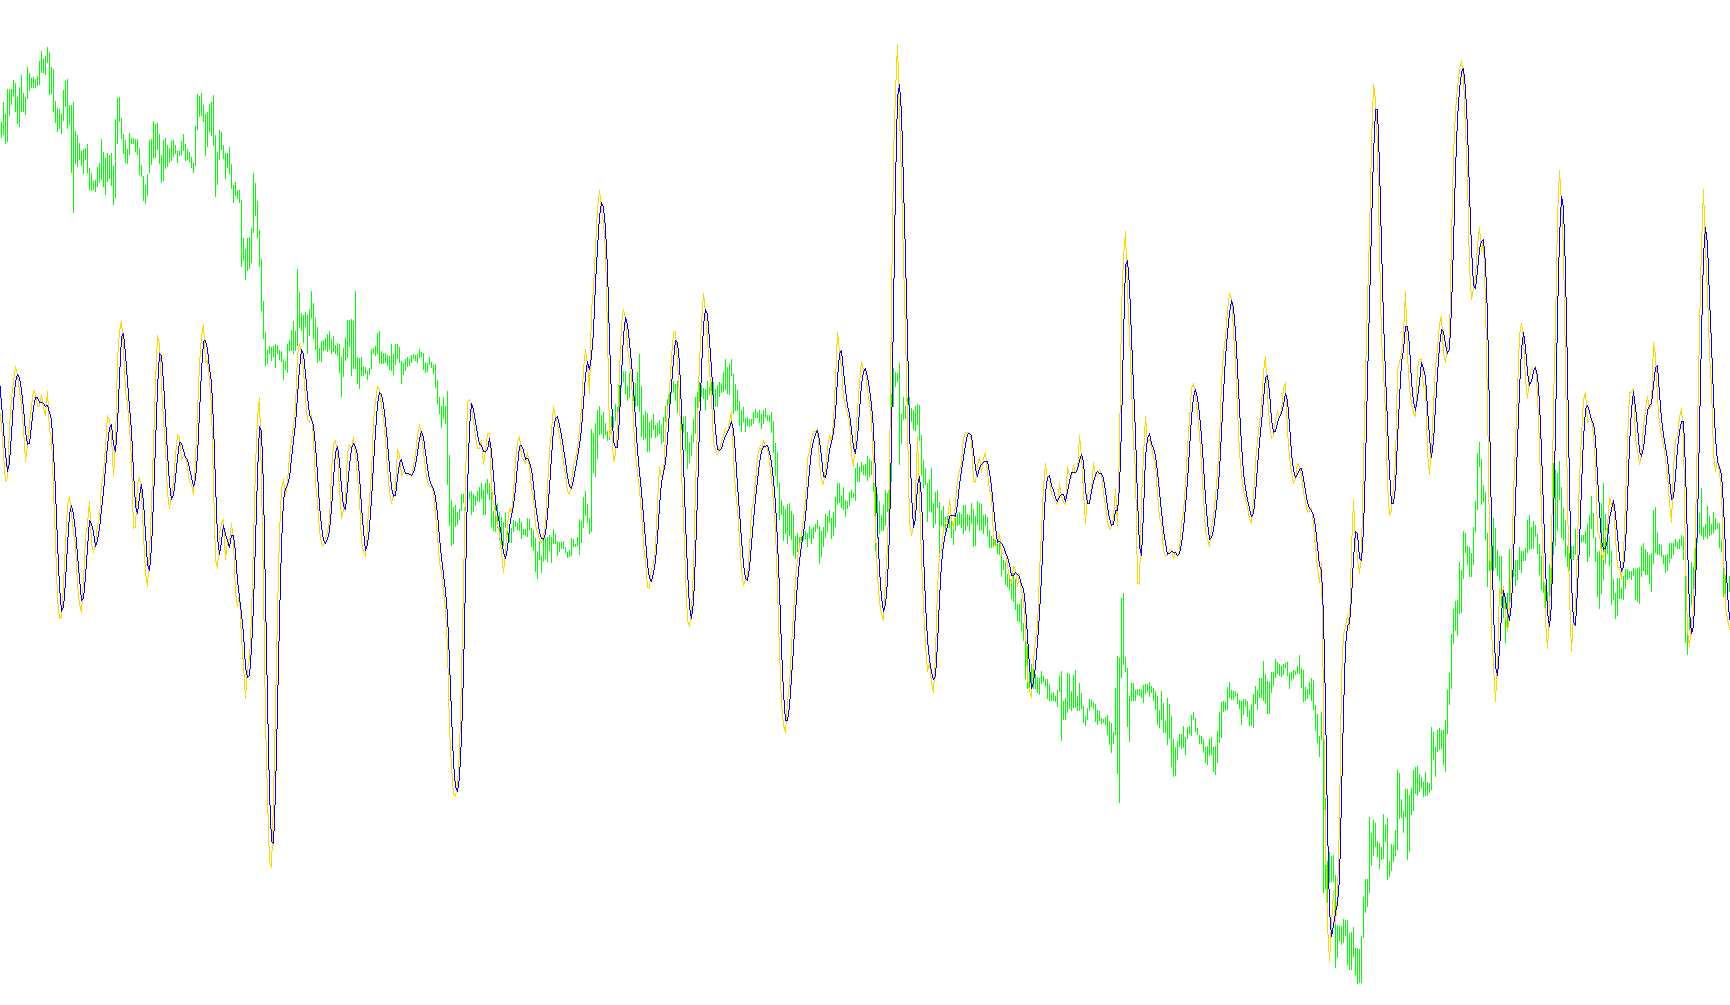
This technical indicator is designed to help traders identify the "Center of Gravity" for price action within a specific timeframe. Instead of looking at just the most recent price, it calculates a weighted average to determine where the balance of trading activity actually sits over a set period.
Core Logic and Functionality
The script operates using a multi-step calculation process to filter out market "noise" and highlight underlying trends:
1. Price Selection Customization The tool allows you to choose which specific price data point should be used for the calculation. You can select standard markers like the Open, High, Low, or Close prices, or use complex averages such as the Median (the midpoint between high and low) or Typical prices. This flexibility ensures the indicator can be tuned to different trading styles.
2. Weighted Price Distribution Rather than treating every price point equally, the logic applies a weight to each candle within your chosen lookback period. It calculates a cumulative value where more recent data points are emphasized differently than older ones. By summing these weighted values and comparing them against a Moving Average, the script identifies the mathematical "center" of the price movement.
3. The Main Signal (Center of Gravity) The primary output—displayed as the first line on your chart—represents this calculated Center of Gravity. It provides a visual representation of where the price "mass" is currently located. When the price moves significantly away from this center, it can indicate overextended movements; when it returns toward it, it may suggest a reversion to the mean.
4. The Smoothing Signal To ensure the data is easy to read and doesn't jump erratically with every minor tick, the script includes a secondary "Signal" line. This is created by applying a smoothing technique (such as a Simple Moving Average) to the Center of Gravity itself.
How to Interpret the Results
The indicator provides two distinct lines:
- The Main Line: Shows the immediate, weighted center of gravity.
- The Signal Line: Acts as a buffer, showing the broader trend of that center.
By observing the relationship between these two lines—such as when the Main Line crosses the Signal Line or stays significantly above/below it—traders can gain insights into momentum shifts and potential trend reversals without being distracted by minor price fluctuations.
//+------------------------------------------------------------------+
//|                                            Center of Gravity.mq4 |
//|                      Copyright © 2007, MetaQuotes Software Corp. |
//|                                        http://www.metaquotes.net |
//+------------------------------------------------------------------+
#property copyright "Copyright © 2007, MetaQuotes Software Corp."
#property link      "http://www.metaquotes.net"
//----
#property indicator_separate_window
#property indicator_buffers 2
#property indicator_color1 Blue
#property indicator_color2 OrangeRed
//---- input parameters
extern int       Per = 10;
extern int       PriceType = 0; // Close
// Constant          Value Description
// PRICE_CLOSE       0     Close price.
// PRICE_OPEN        1     Open price.
// PRICE_HIGH        2     High price.
// PRICE_LOW         3     Low price.
// PRICE_MEDIAN      4     Median price, (high+low)/2.
// PRICE_TYPICAL     5     Typical price, (high+low+close)/3.
// PRICE_WEIGHTED    6     Weighted close price, (high+low+close+close)/4.
extern int       SmoothPer = 3;
extern int       SmoothType = 0; // MODE_SMA
//---- buffers
double ExtMapBuffer1[];
double ExtMapBuffer2[];
//+------------------------------------------------------------------+
//| âîçâðàùàåò öåíó                                                  |
//+------------------------------------------------------------------+
double Price(int shift)
  {
//----
   double res;
//----
   switch (PriceType)
     {
       case PRICE_OPEN:     res = Open[shift]; break;
       case PRICE_HIGH:     res = High[shift]; break;
       case PRICE_LOW:      res = Low[shift]; break;
       case PRICE_MEDIAN:   res = (High[shift] + Low[shift]) / 2.0; break;
       case PRICE_TYPICAL:  res = (High[shift] + Low[shift] +
                                  Close[shift])/3.0; break;
       case PRICE_WEIGHTED: res = (High[shift] + Low[shift] +
                                  2*Close[shift]) / 4.0; break;
       default:             res = Close[shift]; break;
     }
   return(res);
  }
//+------------------------------------------------------------------+
//| Custom indicator initialization function                         |
//+------------------------------------------------------------------+
int init()
  {
//---- indicators
   SetIndexStyle(0, DRAW_LINE);
   SetIndexBuffer(0, ExtMapBuffer1);
   SetIndexLabel(0, "CG Main");
   SetIndexStyle(1, DRAW_LINE);
   SetIndexBuffer(1, ExtMapBuffer2);
   SetIndexLabel(1, "CG Signal");
   IndicatorShortName("CG(" + Per + ", " + SmoothPer + ")");
//----
   return(0);
  }
//+------------------------------------------------------------------+
//| Custom indicator deinitialization function                       |
//+------------------------------------------------------------------+
int deinit()
  {
//----
   return(0);
  }
//+------------------------------------------------------------------+
//| Custom indicator iteration function                              |
//+------------------------------------------------------------------+
int start()
  {
   int counted_bars = IndicatorCounted();
   int i, k, limit, limit1;
//----
   if(counted_bars == 0)
     {
       limit = Bars - Per - 1;
       limit1 = limit - SmoothPer;
     }
   if(counted_bars>0)
     {
       limit = Bars - counted_bars;
       limit1 = limit;
     }
   double P;
   for(i = limit; i >= 0; i--)
     {
       P = 0;
       for(k = 0; k < Per; k++)
           P += (k + 1)*Price(i + k);
       ExtMapBuffer1[i] = -P / (iMA(NULL, 0, Per, 0, MODE_SMA, PriceType, i)*Per);
     }
   for(i = limit1; i >= 0; i--)
       ExtMapBuffer2[i] = iMAOnArray(ExtMapBuffer1, 0, SmoothPer, 0, SmoothType, i);
//----
   return(0);
  }
//+------------------------------------------------------------------+
Comments