Center Of Gravity Oscillator
Download script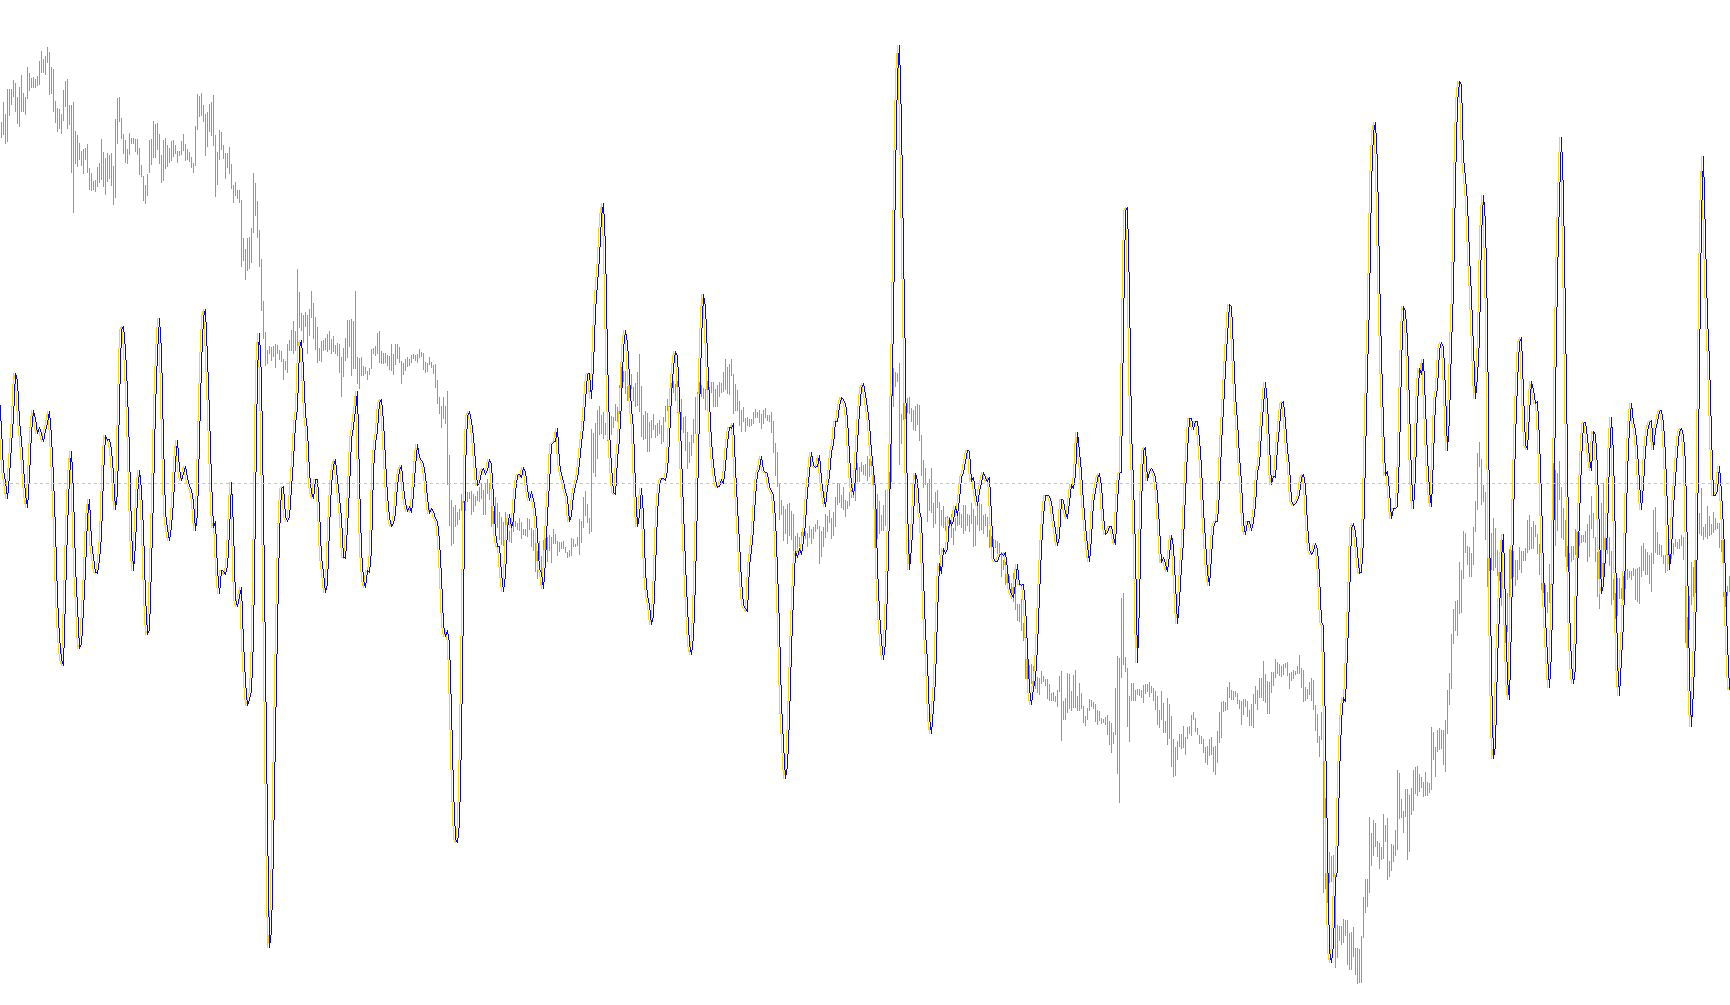
The CG Oscillator is a specialized technical analysis tool designed to help traders visualize price momentum and trends by calculating a weighted average of market movement. Instead of looking at raw prices, this indicator focuses on the relationship between high and low price points over a specific period.
Core Logic and Methodology
The script functions by analyzing a user-defined window of historical data (the "length"). It processes this information through three distinct logical layers:
1. Price Selection Basis Before performing calculations, the tool determines which specific price point to use for its foundation. Depending on the settings, it can focus on the "Median" price (the midpoint between the highest and lowest prices of a candle) or the "Typical" price (an average of the high, low, and closing prices). This allows the user to choose whether they want to emphasize the total range of movement or include the final settlement price.
2. Weighted Distribution Rather than treating every price point in the window equally, the logic applies a weighted distribution. It assigns increasing importance to more recent data points. By doing this, the indicator gives more "weight" to current market conditions while still maintaining a connection to historical context. This helps in identifying whether a trend is accelerating or losing steam.
3. Calculation and Smoothing The script aggregates these weighted prices to produce a final numerical value. It then applies a specific mathematical offset to center the data, ensuring it provides a clear visual representation of movement. Additionally, the indicator tracks the previous calculation point to create a continuous line, making it easier for traders to see the "flow" of the market.
Visual Representation
The result is displayed as a dual-line progression in a separate window below your main chart.
- Yellow Line: Represents the primary calculated oscillator value based on the weighted price data.
- Blue Line: Acts as a reference point, showing the previous state of the calculation to highlight changes in direction or velocity.
By monitoring these lines, traders can better perceive the underlying strength of a market move beyond what is visible on a standard price chart alone.
//+------------------------------------------------------------------+
//|                                            CG Oscillator         |
//|                         Copyright © 2006, Luis Guilherme Damiani |
//|                                      http://www.damianifx.com.br |
//|
//+------------------------------------------------------------------+
#property copyright "Copyright © 2006, Luis Guilherme Damiani"
#property link      "http://www.damianifx.com.br"

#property indicator_buffers 2
#property indicator_separate_window
//#property indicator_chart_window

#property indicator_color1 Yellow
#property indicator_color2 Blue
//#property indicator_color3 Yellow

//---- input parameters
extern double length=8;
//extern int    maxbars=2000;

extern string
Price_Choice="-----  Typical or Median  --------------";
extern bool is_median=true;

//---- buffers
double ind1[];
double ind2[];
//double ind3[];
//double AuxBuffer[]; //Smooth

//+------------------------------------------------------------------+
//| Custom indicator initialization function                         |
//+------------------------------------------------------------------+
int init()
  {
//---- indicators
   SetIndexStyle(0,DRAW_LINE);
   SetIndexBuffer(0,ind1);
   SetIndexStyle(1,DRAW_LINE);
   SetIndexBuffer(1,ind2);
  // SetIndexStyle(2,DRAW_LINE);
  // SetIndexBuffer(2,ind3);
   SetLevelValue(0,0.0);
//   SetLevelValue(1,-0.8);
   ArrayInitialize(ind1,0.0);
   ArrayInitialize(ind2,0.0);
//   ArrayInitialize(ind3,0.0);
///   ArrayResize(AuxBuffer,maxbars+3);
 //  ArrayInitialize(AuxBuffer,0.0);


//----
   return(0);
  }
//+------------------------------------------------------------------+
//| Custor indicator deinitialization function                       |
//+------------------------------------------------------------------+
int deinit()
  {
//----

//----
   return(0);
  }
//+------------------------------------------------------------------+
//| Custom indicator iteration function                              |
//+------------------------------------------------------------------+

int start()
  {

      int    counted_bars=IndicatorCounted();
      double num=0,denom=0;
      //---- check for possible errors
      if(counted_bars<0) return(-1);
      int limit=Bars-counted_bars;
      //if(limit>maxbars)limit=maxbars;
      //if (limit>Bars-1)limit=Bars-1;
      //----
      for (int i = limit; i>=0;i--)
      {
         num=0;denom=0;
         for(int j=0;j<length;j++)
         {
            num=num+(1+j)*Calc_pr(i+j,is_median);
            denom=denom+Calc_pr(i+j,is_median);
         }
         if(denom!=0)
	      ind1[i]=-num/denom + (1+length)/2;
         ind2[i]=ind1[i+1];
       }

//----
   return(0);
  }

 double Calc_pr(int x,bool pricet)
 {
    double pr;
    if(pricet)
            {
               pr=(High[x]+Low[x])/2;

            }
            else
            {
               pr=(High[x]+Low[x]+Close[x])/3;
            }
  return(pr);
 }
//+------------------------------------------------------------------+
Comments