Center of Gravity2
Download script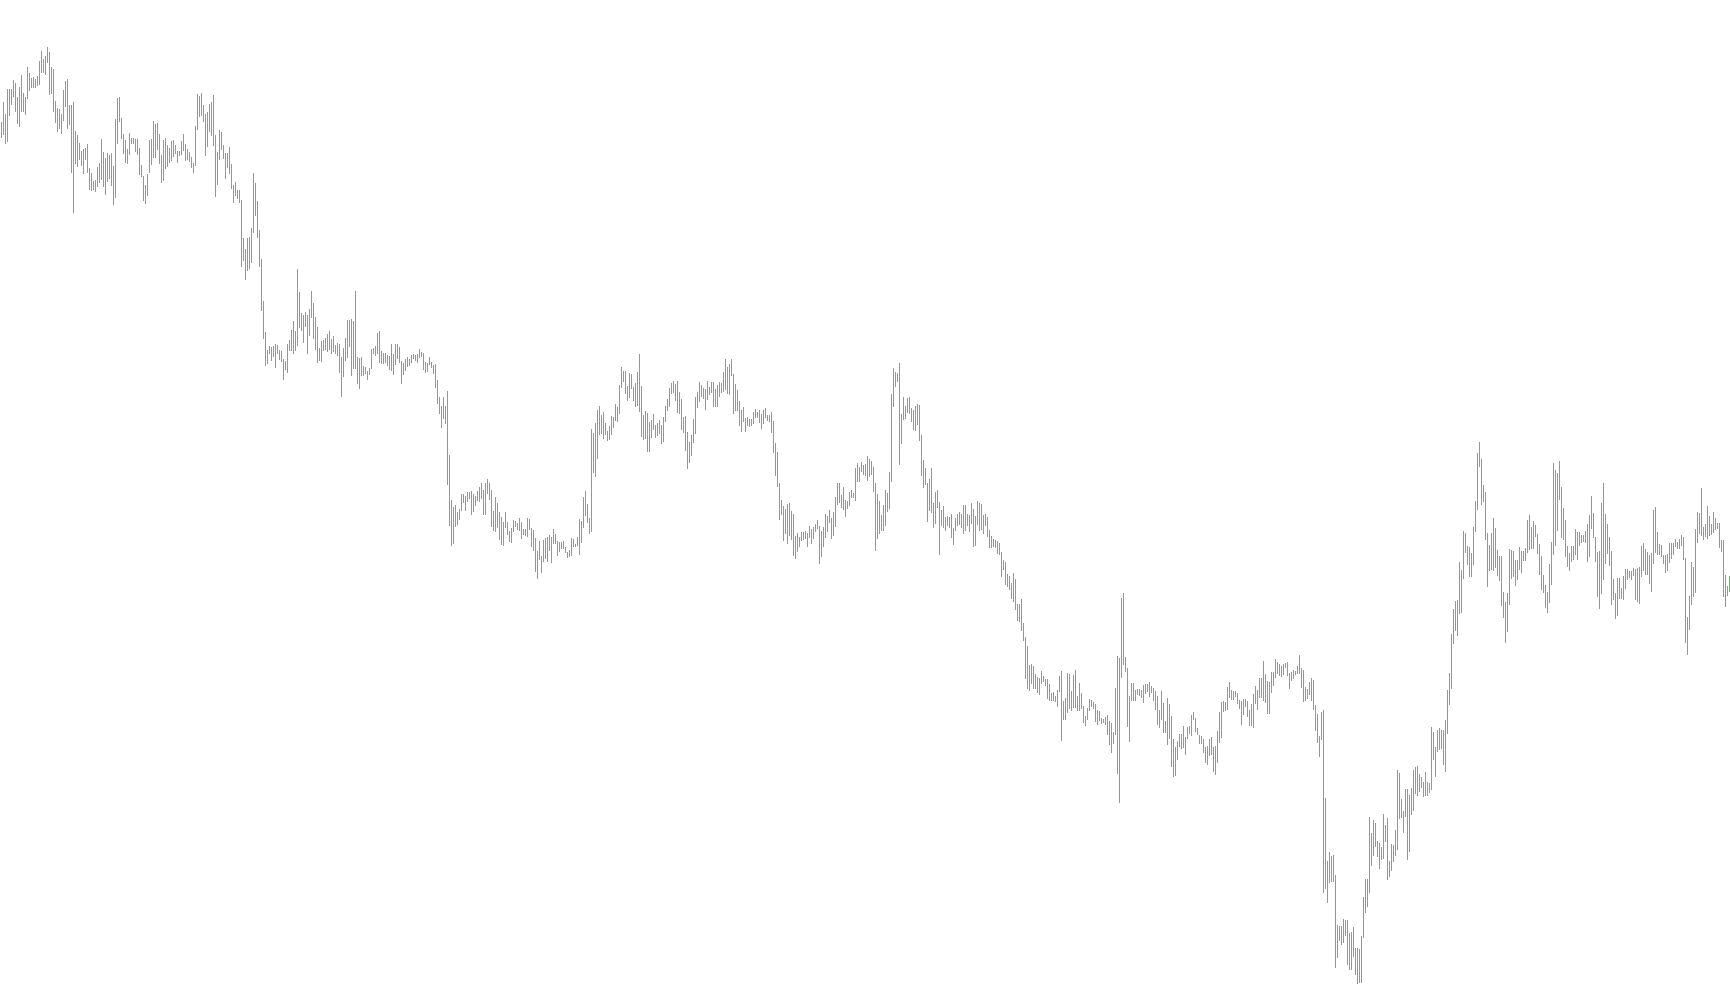
The Center of Gravity indicator is designed to provide traders with a visual representation of the "balance point" of price action over a specific period. Rather than simply looking at where the current price is sitting, this tool analyzes the weighted distribution of price highs and lows to determine where the core momentum resides.
How the Logic Works
The script functions by performing a mathematical calculation based on two primary components:
1. Identifying the Mid-Point Price For every candle within a chosen timeframe (defined by the "Par" setting), the indicator first calculates the midpoint between that candle's highest and lowest price. This simplifies the complex movement of the market into a single, average price point for each specific interval.
2. Calculating Weighted Distribution The core logic does not treat all candles equally. It applies a "weighting" system to these midpoints based on their chronological order within the lookback period. By multiplying the midpoint values by their position in the sequence, the indicator assigns more significance to more recent price action while still maintaining the context of historical data.
3. Determining the Center of Gravity The final value displayed is derived by dividing the total sum of these midpoints by the weighted sum. This produces a specific "Center of Gravity" value.
Visual Representation
The indicator renders this data as lines in a separate window below your main price chart. By observing how these lines move, traders can identify:
- Equilibrium Zones: Areas where price feels "heavy" or anchored.
- Momentum Shifts: Significant deviations where the center of gravity moves away from the current price, potentially signaling an upcoming correction or trend reversal.
- Trend Strength: The speed and direction at which the center of gravity shifts relative to previous values.
In essence, this tool helps filter out minor market "noise" by focusing on the underlying structural balance of price movement over a set number of bars.
//+------------------------------------------------------------------+

//| Center of Gravity.mq4

//|

//+------------------------------------------------------------------+

#property copyright "Copyright 2002, Finware.ru Ltd."

#property link "http://www.finware.ru/"


#property indicator_separate_window

#property indicator_buffers 2

#property indicator_color1 Blue

#property indicator_color2 Red


//Inputs : Per(10);

//Variable : shift(0),StartBar(600);

//Variable : value1(0), sum(0),sum1(0), cnt(0);


extern int Par=10;

extern int CountBars=300;

//---- buffers

double val1[];

double val2[];


//+------------------------------------------------------------------+

//| Custom indicator initialization function |

//+------------------------------------------------------------------+

int init()

{

string short_name;

//---- indicator line

IndicatorBuffers(2);

SetIndexStyle(0,DRAW_LINE);

SetIndexBuffer(0,val1);

SetIndexStyle(1,DRAW_LINE);

SetIndexBuffer(1,val2);

//----

return(0);

}

//+------------------------------------------------------------------+

//| Center of Gravity |

//+------------------------------------------------------------------+

int start()

{

if (CountBars>=Bars) CountBars=Bars;

SetIndexDrawBegin(0,Bars-CountBars+Par+1);

SetIndexDrawBegin(1,Bars-CountBars+Par+1);

int i,cnt,counted_bars=IndicatorCounted();

double value1,sum,sum1;

//----

if(Bars<=38) return(0);

//---- initial zero

if(counted_bars<Par)

{

for(i=1;i<=0;i++) val1[CountBars-i]=0.0;

for(i=1;i<=0;i++) val2[CountBars-i]=0.0;

}

//----

i=CountBars-Par-1;

// if(counted_bars>=39) i=Bars-counted_bars-1;

while(i>=0)

{


sum = 0.0;

for (cnt=0; cnt<=Par-1; cnt++)

{

sum = sum + (High[i+cnt]+Low[i+cnt])/2;

}


sum1=0.0;

for (cnt=0; cnt<=Par-1; cnt++)

{

sum1=sum1+((High[i+cnt]+Low[i+cnt])*(cnt+1)/2);

}


value1=sum/sum1;

//SetIndexValue(i,value1);

//SetIndexValue2(i-1,value1);


val1[i]=value1;

if (i>0) val2[i-1]=value1;


i--;

}

return(0);

} //+------------------------------------------------------------------+
Comments