Chaikin's Volatility(1)
Download script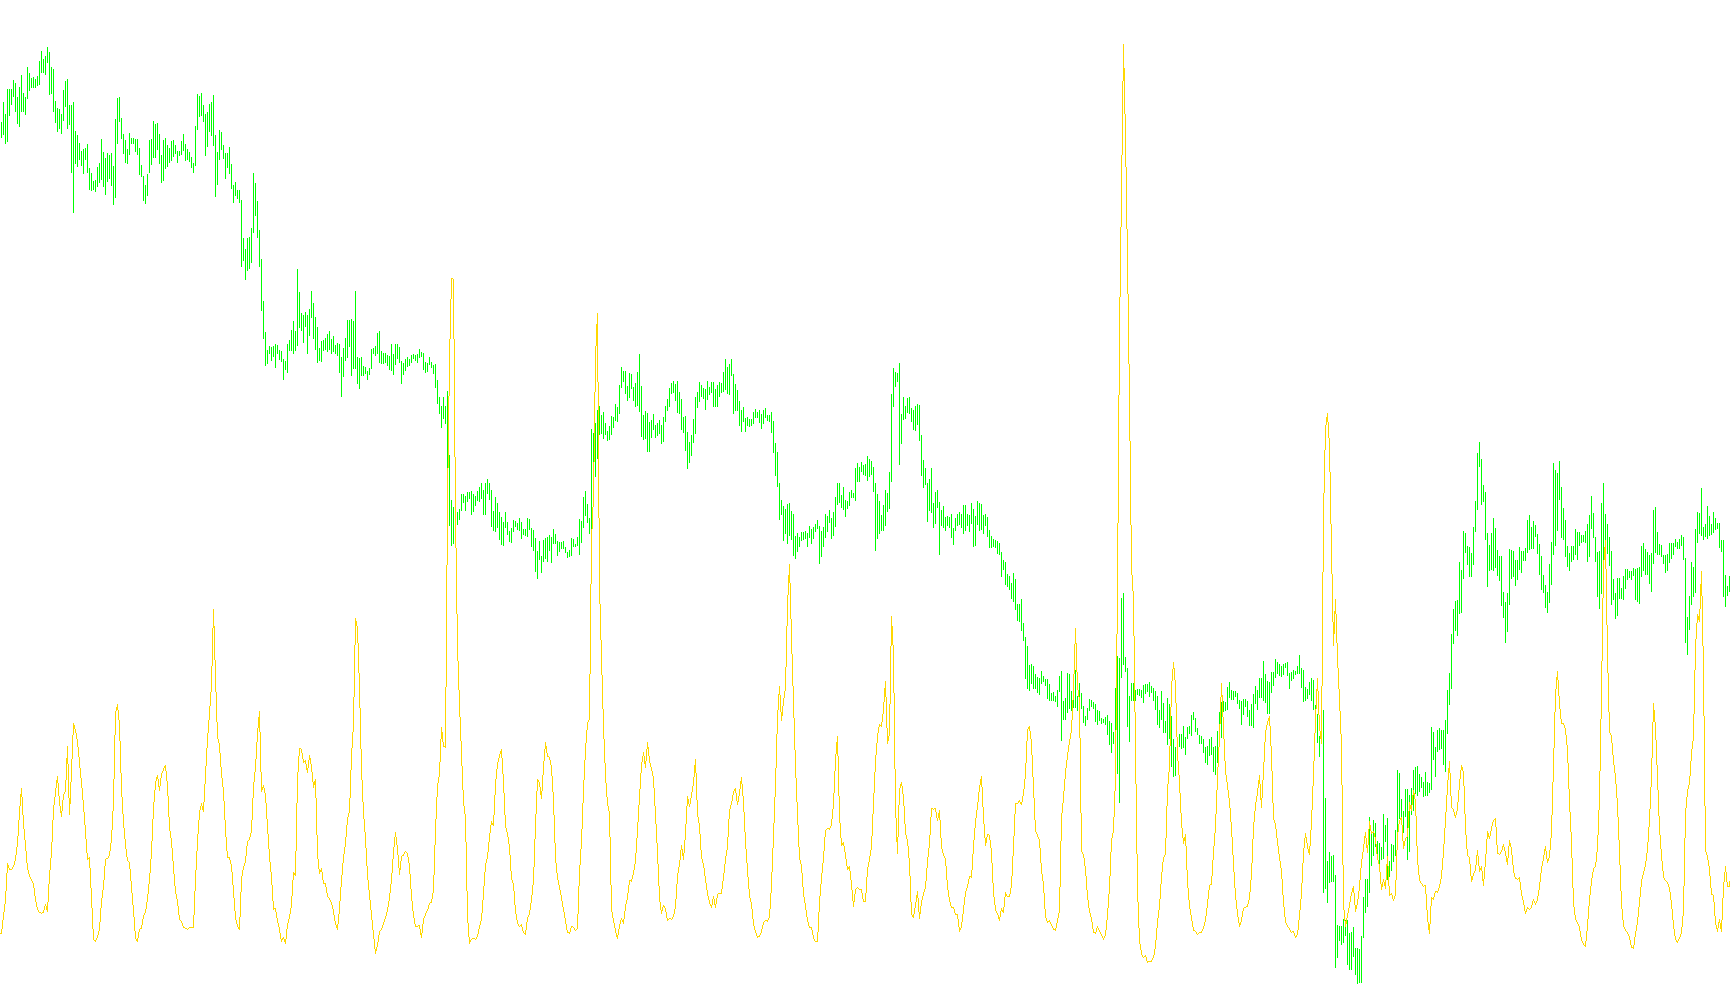
This technical tool, known as Chaikin's Volatility, is designed to help traders visualize the intensity and momentum of price movements by analyzing the historical range of a financial instrument. Instead of looking at the price alone, this script focuses on "volatility"—the measure of how much the price fluctuates within specific timeframes.
How the Logic Works
The indicator processes market data through three distinct logical layers to arrive at its final visual output:
1. Calculating the Price Range The first step the script takes is identifying the "High" and "Low" points for every individual candle on the chart. By subtracting the low from the high, it determines the total price distance covered during that specific period. This represents the raw volatility of each bar.
2. Smoothing the Volatility (EMA) Raw volatility can be erratic and jump around significantly. To make the data more readable and less "noisy," the script applies an Exponential Moving Average (EMA) to those high-low ranges. This smoothing process helps highlight the underlying trend of the market's activity, making it easier to see if the market is becoming consistently more volatile or calmer over time.
3. Measuring the Rate of Change The final step involves comparing the current smoothed volatility against a past value (determined by a user-defined period). The script calculates the percentage difference between these two points in time.
What This Tells the User
Rather than showing you where the price is going, this indicator shows you the speed and strength of the market's movement.
- Increasing Values: Suggest that volatility is expanding, which often happens during strong trend breakouts or periods of high emotional trading.
- Decreasing Values: Suggest that the market is stabilizing or "calming down," which may indicate a consolidation phase or a loss of momentum.
By focusing on these percentage shifts in volatility, the tool provides a clearer picture of the market's "energy," helping traders distinguish between quiet periods and significant moves where price action is accelerating rapidly.
//+------------------------------------------------------------------+
//|                                         Chaikin's Volatility.mq4 |
//|                                                          Kalenzo |
//|                                      bartlomiej.gorski@gmail.com |
//+------------------------------------------------------------------+
#property copyright "Kalenzo"
#property link      "bartlomiej.gorski@gmail.com"

#property indicator_separate_window
#property indicator_buffers 1
#property indicator_color1 DeepSkyBlue

//---- input parameters
extern int       iPeriod=10;
extern int       maPeriod=10;
//---- buffers
double chakin[];
double hl[];
double emahl[];
//+------------------------------------------------------------------+
//| Custom indicator initialization function                         |
//+------------------------------------------------------------------+
int init()
  {
//---- indicators
   IndicatorBuffers(3);
   SetIndexStyle(0,DRAW_LINE);
   SetIndexBuffer(0,chakin);

   SetIndexBuffer(1,hl);
   SetIndexBuffer(2,emahl);
//----
   return(0);
  }
//+------------------------------------------------------------------+
//| Custom indicator deinitialization function                       |
//+------------------------------------------------------------------+
int deinit()
  {
//----

//----
   return(0);
  }
//+------------------------------------------------------------------+
//| Custom indicator iteration function                              |
//+------------------------------------------------------------------+
int start()
  {
   int limit;
   int counted_bars=IndicatorCounted();
   if(counted_bars<0) counted_bars=0;
   if(counted_bars>0) counted_bars--;
   limit=Bars-counted_bars;
//----
   for(int c = 0 ;c <= limit ;c++) hl[c]=High[c]-Low[c];
   for(int e = 0 ;e <= limit ;e++) emahl[e]= iMAOnArray(hl,0,maPeriod,0,MODE_EMA,e);

   for(int i = 0 ;i <= limit-20 ;i++)
   {

      chakin[i] = ( (emahl[i]-emahl[i+iPeriod])/emahl[i+iPeriod] ) *100;
   }
//----
   return(0);
  }
//+------------------------------------------------------------------+
Comments