Center of Gravity_001
Download script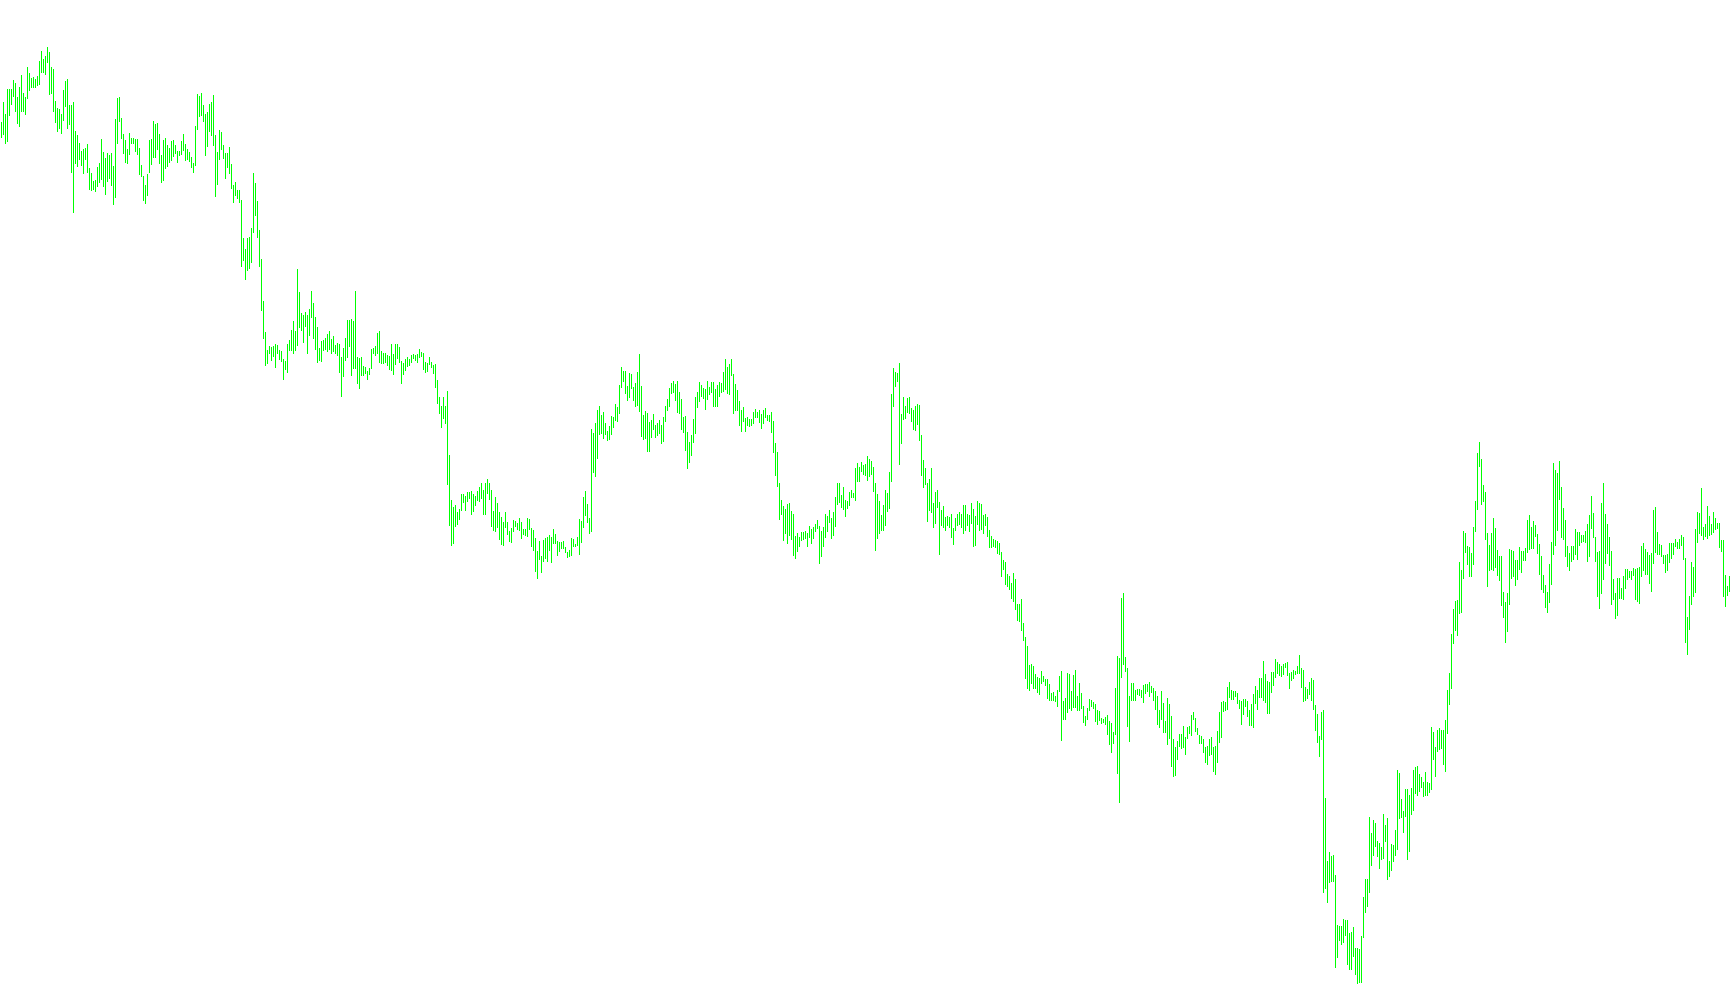
This indicator is designed to provide traders with a visual representation of the "Center of Gravity" for price action within a specific timeframe. Rather than simply looking at where the price is currently sitting, this tool analyzes the distribution of price movements over a set period to identify a weighted equilibrium point.
How the Logic Works
The script functions by examining a rolling window of historical data (the number of bars) to calculate the relationship between price highs and lows. Here is the step-by-step breakdown of its internal logic:
1. Data Gathering The indicator looks at a predefined period of time (defaulting to 10 bars). For every bar within this window, it identifies the highest price reached and the lowest price reached, calculating the midpoint for each.
2. Weighted Distribution Instead of treating all price points as equal, the logic applies a "weighting" system. It calculates two different sums:
- The Simple Sum: A total of all price midpoints within the period.
- The Weighted Sum: A calculation where more recent price actions are given more importance than older ones in the sequence. This ensures that the most current market behavior has a stronger influence on the resulting "Center" than data from several bars ago.
3. The Center of Gravity Calculation By dividing the Simple Sum by the Weighted Sum, the script derives a single value. This value represents the mathematical center of gravity for that specific period. It tells you where the "balance" of price is currently leaning based on the momentum and distribution of recent trading activity.
4. Visual Output The result is plotted as two distinct lines in a separate window below your main chart:
- The primary line represents the current calculation.
- The secondary line provides a slight offset, allowing traders to visually identify shifts in equilibrium or "gravity" between the current bar and the previous one.
Practical Purpose
For a trader, this indicator helps filter out market noise. When the price is far above the Center of Gravity, it may suggest an overextended move; when it sits near the line, it suggests the market is finding a balance point. By watching how these lines shift over time, you can better understand whether the "weight" of the market is shifting toward bullish or bearish territory.
//+------------------------------------------------------------------+

//| Center of Gravity.mq4

//|

//+------------------------------------------------------------------+

#property copyright "Copyright 2002, Finware.ru Ltd."

#property link "http://www.finware.ru/"


#property indicator_separate_window

#property indicator_buffers 2

#property indicator_color1 Blue

#property indicator_color2 Red


//Inputs : Per(10);

//Variable : shift(0),StartBar(600);

//Variable : value1(0), sum(0),sum1(0), cnt(0);


extern int Per=10;

extern int CountBars=300;

//---- buffers

double val1[];

double val2[];


//+------------------------------------------------------------------+

//| Custom indicator initialization function |

//+------------------------------------------------------------------+

int init()

{

string short_name;

//---- indicator line

IndicatorBuffers(2);

SetIndexStyle(0,DRAW_LINE);

SetIndexBuffer(0,val1);

SetIndexStyle(1,DRAW_LINE);

SetIndexBuffer(1,val2);

//----

return(0);

}

//+------------------------------------------------------------------+

//| Center of Gravity |

//+------------------------------------------------------------------+

int start()

{

if (CountBars>=Bars) CountBars=Bars;

SetIndexDrawBegin(0,Bars-CountBars+Per+1);

SetIndexDrawBegin(1,Bars-CountBars+Per+1);

int i,cnt,counted_bars=IndicatorCounted();

double value1,sum,sum1;

//----

if(Bars<=38) return(0);

//---- initial zero

if(counted_bars<Per)

{

for(i=1;i<=0;i++) val1[CountBars-i]=0.0;

for(i=1;i<=0;i++) val2[CountBars-i]=0.0;

}

//----

i=CountBars-Per-1;

// if(counted_bars>=39) i=Bars-counted_bars-1;

while(i>=0)

{


sum = 0.0;

for (cnt=0; cnt<=Per-1; cnt++)

{

sum = sum + (High[i+cnt]+Low[i+cnt])/2;

}


sum1=0.0;

for (cnt=0; cnt<=Per-1; cnt++)

{

sum1=sum1+((High[i+cnt]+Low[i+cnt])*(cnt+1)/2);

}


value1=sum/sum1;

//SetIndexValue(i,value1);

//SetIndexValue2(i-1,value1);


val1[i]=value1;

if (i>0) val2[i-1]=value1;


i--;

}

return(0);

} //+------------------------------------------------------------------+
Comments