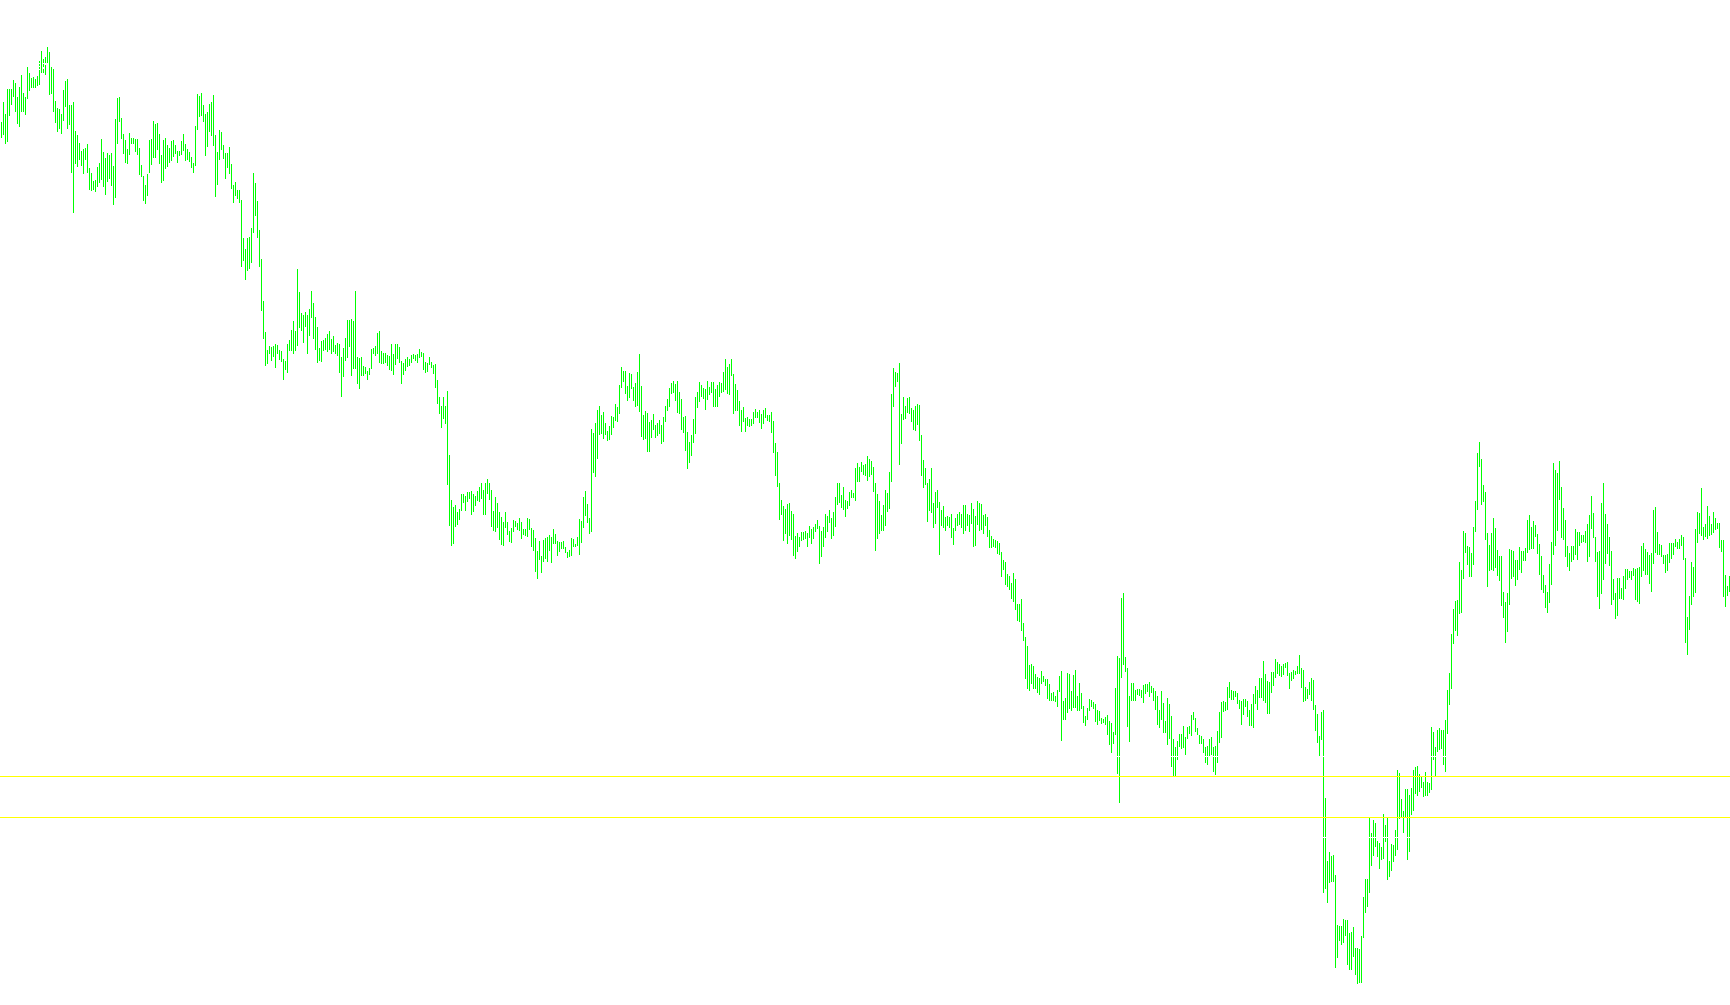
This script is designed as a specialized charting tool for MetaTrader to automatically identify and visualize key price levels based on the previous day's trading activity. Specifically, it implements the Camarilla Pivot Point methodology, which is frequently used by traders to determine potential support and resistance zones for the current day.
Core Logic and Functionality
The script operates by analyzing historical data from the daily timeframe to calculate four specific price points: two "Resistance" levels (R3, R4) and two "Support" levels (S3, S4). Here is how the logic flows:
1. Data Collection The tool begins by scanning the previous day's completed candle to extract three vital pieces of information:
- The highest price reached (High)
- The lowest price reached (Low)
- The final price at which the market closed (Close)
2. Range Calculation Once it has these figures, the script calculates the "Range"—the total distance between the day's high and low. This range is the foundation for all subsequent calculations, as it represents the daily volatility of the asset.
3. Mathematical Modeling Using the previous day's range and closing price, the script performs specific arithmetic to project four horizontal lines:
- Resistance Levels (R3 & R4): These represent upper boundaries where price might face difficulty moving higher. They are calculated by adding a fraction of the daily range to the previous day's closing price.
- Support Levels (S3 & S4): These represent lower boundaries where price might find "bottom" support before potentially rebounding. They are calculated by subtracting a fraction of the daily range from the previous day's closing price.
4. Visual Output Finally, the script handles all the visual heavy lifting on your chart:
- Dynamic Drawing: It automatically draws four solid horizontal lines across your current screen at the exact prices calculated.
- Color Coding: To help with quick analysis, it distinguishes the levels by color (for example, using White for outer levels and Yellow for inner levels).
- Real-time Updates: Every time the chart refreshes, the script clears the old lines and redraws them to ensure the data remains accurate.
- On-Screen Summary: It provides a text summary in the corner of your chart, listing the exact numerical values for all four levels (R4, R3, S3, and S4) so you can see the precise figures at a glance.
//+------------------------------------------------------------------+
//|                                                          PV4.mq4 |
//|                                                        Jim Arner |
//|                                                                  |
//+------------------------------------------------------------------+

#property indicator_chart_window
//+------------------------------------------------------------------+
//| Custom indicator initialization function                         |
//+------------------------------------------------------------------+

int init()
  {
//---- indicators

//---- indicators


//----
   return(0);
  }
//+------------------------------------------------------------------+
//| Custor indicator deinitialization function                       |
//+------------------------------------------------------------------+
int deinit()
  {
//---- TODO: add your code here

//----
   return(0);
  }
//+------------------------------------------------------------------+
//| Custom indicator iteration function                              |
//+------------------------------------------------------------------+
int start()
  {

   double yesterday_high;
   double yesterday_low;
   double yesterday_close;
   double array_price[][6];
   double P,R4,R3,S3,S4;

//---- TODO: add your code here

ArrayInitialize(array_price,0);
ArrayCopyRates(array_price,(Symbol()), PERIOD_D1);

yesterday_high = array_price[1][3];
yesterday_low = array_price[1][2];
yesterday_close = array_price[1][4];

P = yesterday_high - yesterday_low;

R4 = (1.1*P/2)+yesterday_close;
R3 = (1.1*P/4)+yesterday_close;

S3 = yesterday_close - (P*1.1/4);
S4 = yesterday_close - (P*1.1/2);

Comment("Camarilla Levels by Bin-Yagoub","\nR4=",R4,"\nR3=",R3,"\nS3=",S3,"\nS4=",S4);

ObjectDelete("S4_Line");
ObjectDelete("R4_Line");

ObjectDelete("S3_Line");
ObjectDelete("R3_Line");

ObjectCreate("S4_Line", OBJ_HLINE,0, CurTime(),S4);
ObjectSet("S4_Line",OBJPROP_COLOR,White);
ObjectSet("S4_Line",OBJPROP_STYLE,STYLE_SOLID);

ObjectCreate("R4_Line", OBJ_HLINE,0, CurTime(),R4);
ObjectSet("R4_Line",OBJPROP_COLOR,White);
ObjectSet("R4_Line",OBJPROP_STYLE,STYLE_SOLID);

ObjectCreate("S3_Line", OBJ_HLINE,0, CurTime(),S3);
ObjectSet("S3_Line",OBJPROP_COLOR,Yellow);
ObjectSet("S3_Line",OBJPROP_STYLE,STYLE_SOLID);

ObjectCreate("R3_Line", OBJ_HLINE,0, CurTime(),R3);
ObjectSet("R3_Line",OBJPROP_COLOR,Yellow);
ObjectSet("R3_Line",OBJPROP_STYLE,STYLE_SOLID);

ObjectsRedraw();

   return(0);
 }
//+------------------------------------------------------------------+
Comments