Camarilla-MT04-Ind_MBB_v2
Download script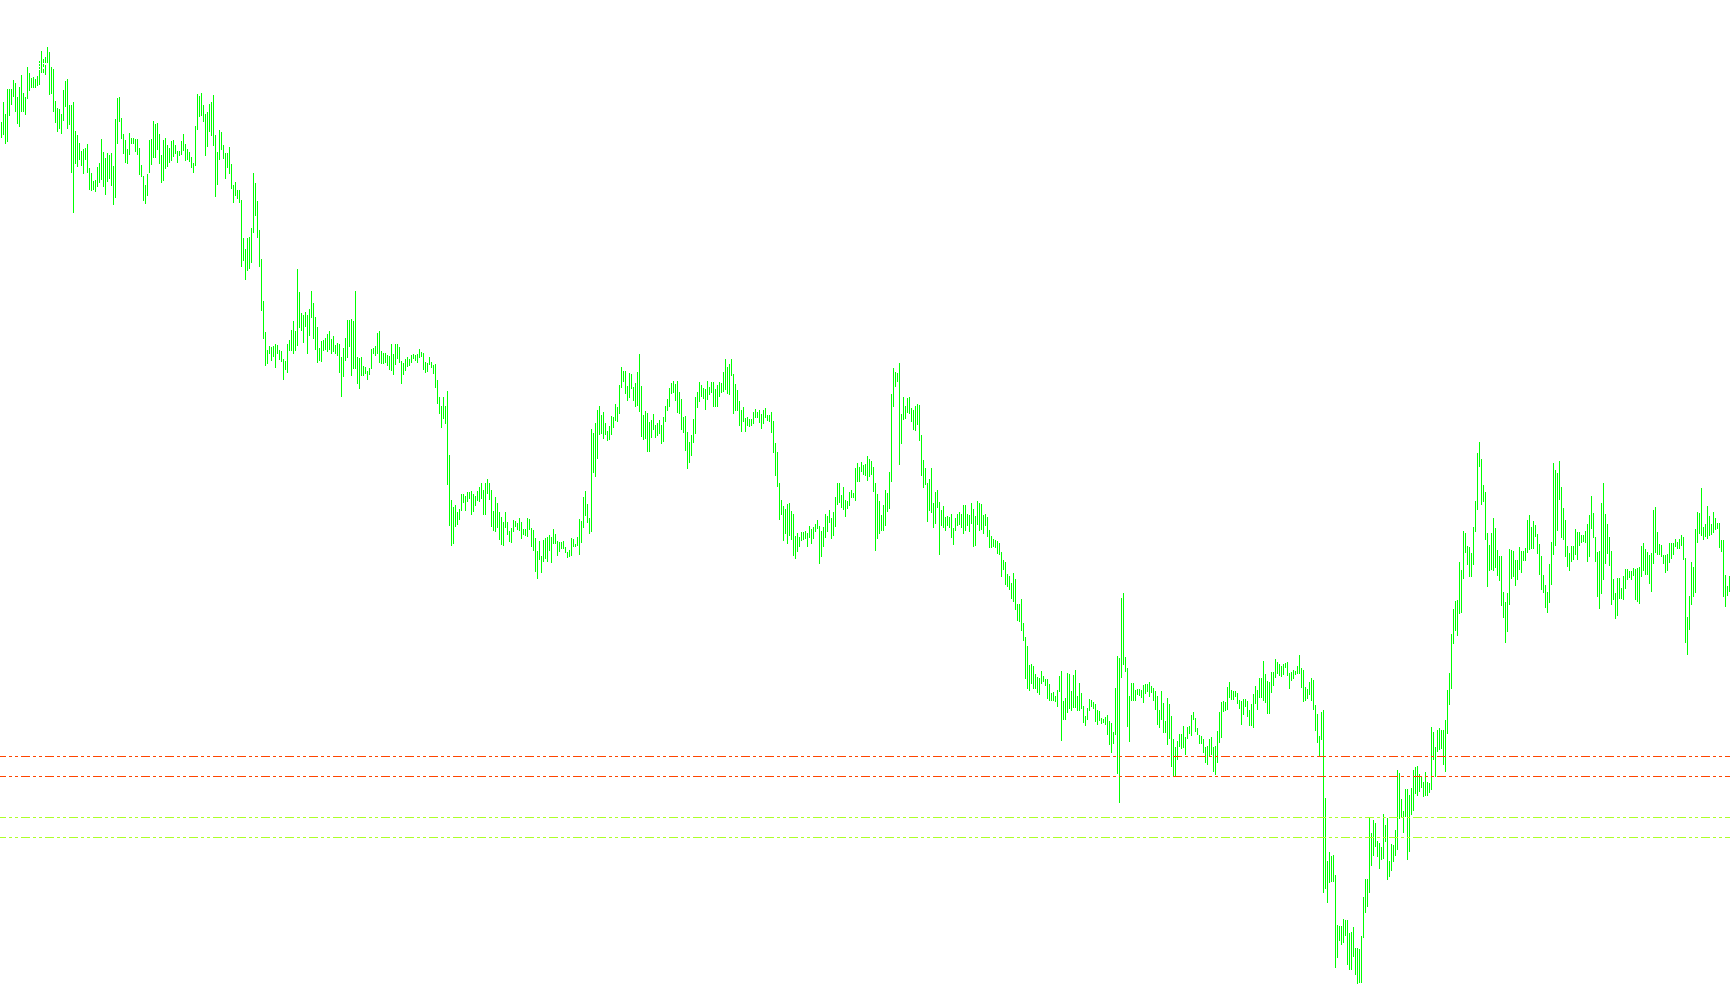
This tool is designed to automatically calculate and display key "Camarilla Pivot" price levels on your trading chart based on the previous day's market activity. By analyzing historical data, the script identifies specific zones where significant price action or reversals may occur, helping traders visualize potential support and resistance boundaries in real-time.
How the Logic Works
The script follows a systematic process to generate these levels every time the chart updates:
1. Historical Data Collection The tool first looks back at the completed trading session of the previous day. It automatically extracts three critical pieces of information from that day's performance:
- The highest price reached (High).
- The lowest price reached (Low).
- The final price at which the market closed (Close).
2. Range Calculation Once it has these three values, the script calculates the "Price Range" of the previous day by finding the difference between the high and the low. This range serves as the foundation for all subsequent calculations, as it represents the total volatility and movement experienced during the last session.
3. Level Generation (Camarilla Logic) Using the price range and the previous day's closing price, the script applies a specific mathematical formula to determine four primary levels:
- Resistance Levels (R3 & R4): These represent "ceiling" areas. The script calculates these by adding a fraction of the daily range to the closing price. These are often viewed as targets for upward momentum or zones where selling pressure might increase.
- Support Levels (S3 & S4): These represent "floor" areas. The script subtracts a fraction of the daily range from the closing price. These are typically viewed as zones where buying interest may emerge or where downward momentum might stall.
4. Visual Display on Chart After performing these calculations, the script handles all the visual heavy lifting for you:
- It automatically clears any old lines from the chart to ensure the data is current.
- It draws four distinct horizontal lines across your screen.
- It applies specific colors (Orange-Red for Resistance and Green-Yellow for Support) and a dashed style to differentiate between "ceiling" and "floor" levels.
- It updates these lines instantly as new price data becomes available, providing you with a dynamic view of the market's key structural boundaries.
/*-----------------------------+
|			       |
| Shared by www.Aptrafx.com    |
|			       |
+------------------------------*/

//+------------------------------------------------------------------+
//|                                                          PV4.mq4 |
//|                                                        Jim Arner |
//|                                                                  |
//+------------------------------------------------------------------+

#property indicator_chart_window
//+------------------------------------------------------------------+
//| Custom indicator initialization function                         |
//+------------------------------------------------------------------+

int init()
  {
//---- indicators

//---- indicators


//----
   return(0);
  }
//+------------------------------------------------------------------+
//| Custor indicator deinitialization function                       |
//+------------------------------------------------------------------+
int deinit()
  {
//---- TODO: add your code here

//----
   return(0);
  }
//+------------------------------------------------------------------+
//| Custom indicator iteration function                              |
//+------------------------------------------------------------------+
int start()
  {

   double yesterday_high;
   double yesterday_low;
   double yesterday_close;
   double array_price[][6];
   double P,R4,R3,S3,S4;

//---- TODO: add your code here

ArrayInitialize(array_price,0);
ArrayCopyRates(array_price,(Symbol()), PERIOD_D1);

yesterday_high = array_price[1][3];
yesterday_low = array_price[1][2];
yesterday_close = array_price[1][4];

P = yesterday_high - yesterday_low;

R4 = (1.1*P/2)+yesterday_close;
R3 = (1.1*P/4)+yesterday_close;

S3 = yesterday_close - (P*1.1/4);
S4 = yesterday_close - (P*1.1/2);

Comment("Camarilla Levels by Bin-Yagoub","\nR4=",R4,"\nR3=",R3,"\nS3=",S3,"\nS4=",S4);

ObjectDelete("S4_Line");
ObjectDelete("R4_Line");

ObjectDelete("S3_Line");
ObjectDelete("R3_Line");

ObjectCreate("S4_Line", OBJ_HLINE,0, CurTime(),S4);
ObjectSet("S4_Line",OBJPROP_COLOR,GreenYellow);
ObjectSet("S4_Line",OBJPROP_STYLE,STYLE_DASHDOTDOT);

ObjectCreate("R4_Line", OBJ_HLINE,0, CurTime(),R4);
ObjectSet("R4_Line",OBJPROP_COLOR,OrangeRed);
ObjectSet("R4_Line",OBJPROP_STYLE,STYLE_DASHDOTDOT);

ObjectCreate("S3_Line", OBJ_HLINE,0, CurTime(),S3);
ObjectSet("S3_Line",OBJPROP_COLOR,GreenYellow);
ObjectSet("S3_Line",OBJPROP_STYLE,STYLE_DASHDOTDOT);

ObjectCreate("R3_Line", OBJ_HLINE,0, CurTime(),R3);
ObjectSet("R3_Line",OBJPROP_COLOR,OrangeRed);
ObjectSet("R3_Line",OBJPROP_STYLE,STYLE_DASHDOTDOT);

ObjectsRedraw();

   return(0);
 }
//+------------------------------------------------------------------+
Comments