camarilladt1
Download script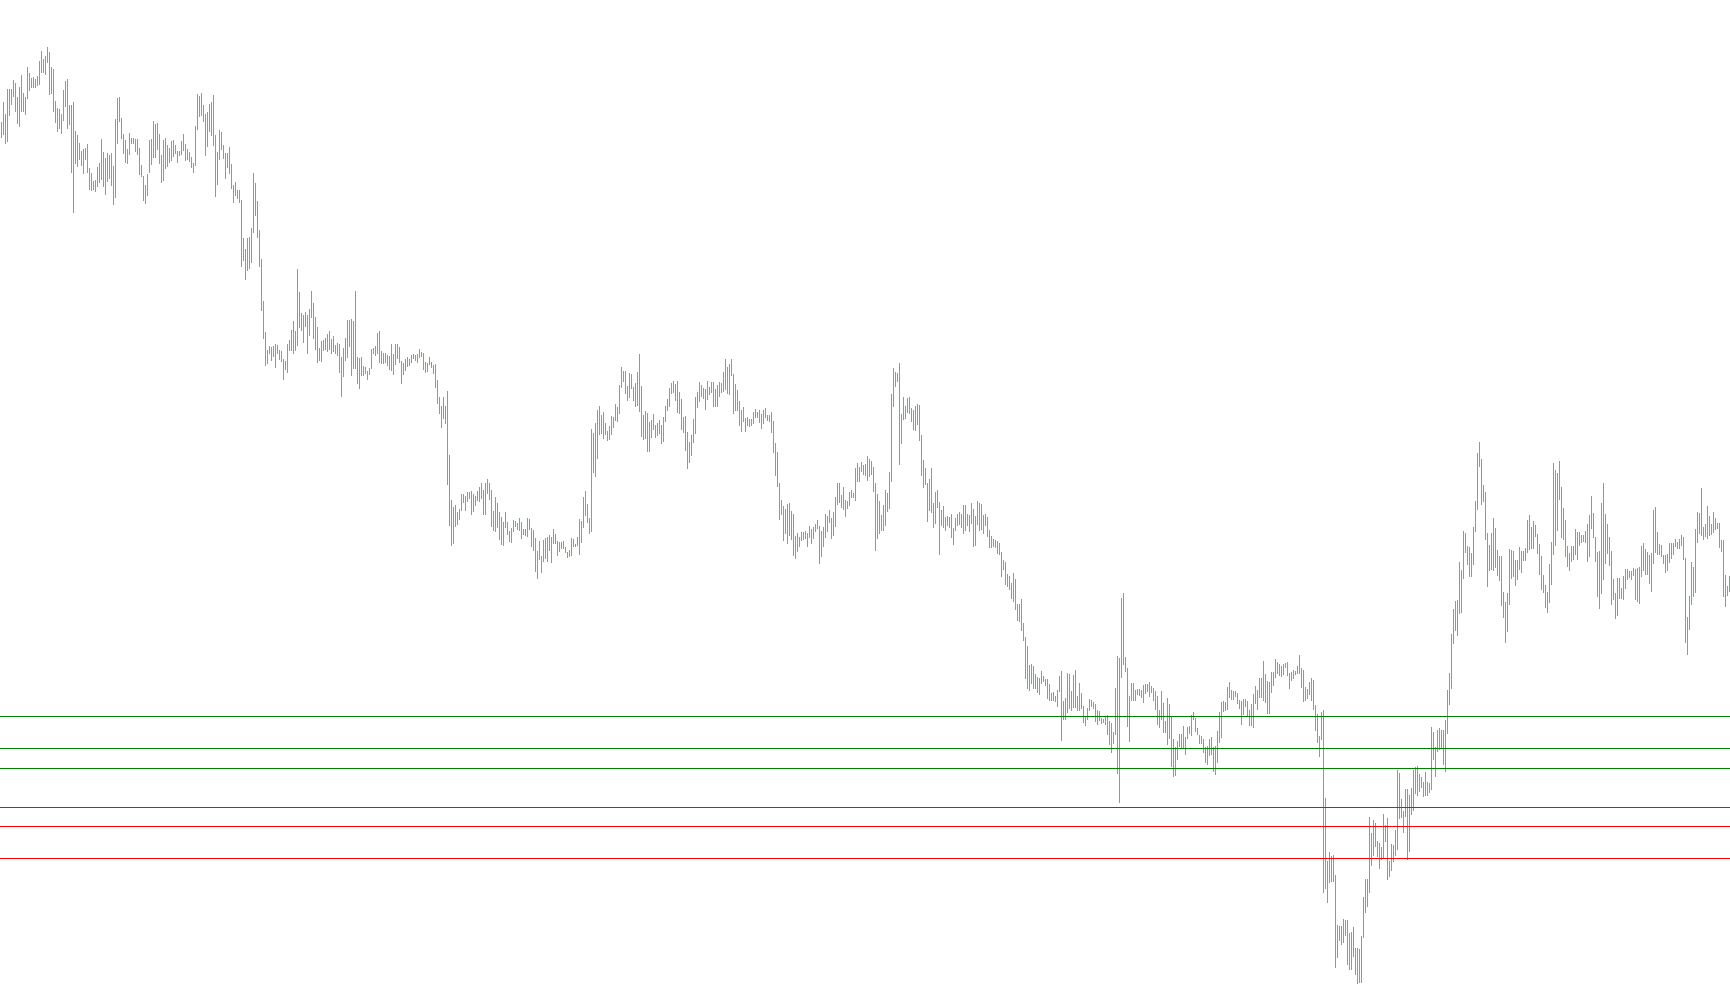
This script is a specialized technical analysis tool designed for the MetaTrader trading platform. It automatically calculates and displays various price levels on your chart to help identify potential support, resistance, and breakout zones based on historical price action.
How it Works
The tool operates by analyzing recent market data—specifically looking at the high, low, and closing prices of previous days. It then uses these figures to project several different types of mathematical "pivot points" onto your current chart.
Key Features and Logic
1. Data Processing The script scans through historical price bars to identify the boundaries of the previous trading day (the highest and lowest prices reached). Once it has identified these benchmarks, it performs a series of calculations to determine today's key price levels. It also includes a safety check to ensure the tool is only used on intraday charts (shorter than a 1-day timeframe), as its logic is built specifically for daily cycle analysis.
2. Pivot Point Calculations The script calculates standard Pivot Points, which are used by many traders to gauge the "fair value" of the market for the day:
- Central Pivot: The baseline price for the current session.
- Resistance Levels (R1, R2, R3): These represent "ceilings" where the price may struggle to move higher.
- Support Levels (S1, S2, S3): These represent "floors" where the price may find a reason to bounce back up.
3. Camarilla Trading Ranges The tool features a specific logic for "Camarilla" levels. These are specialized price points often used by breakout traders. They identify specific zones:
- Breakout Targets: Levels that signal a strong move in either direction.
- Short/Long Zones: Specific areas where traders look for potential reversals or trend continuations.
4. Midpoint Analysis Users can opt to display "Midpoint Pivots." These are the mathematical averages between different resistance and support levels, providing even finer granularity for identifying subtle shifts in market sentiment.
Visual Interface
Instead of just showing you raw numbers, the script draws these levels directly on your chart as horizontal lines. It automatically labels them (e.g., "H3 Short," "R1," etc.) so you can see exactly what each line represents in real-time.
Additionally, it provides a text summary in the corner of your screen showing the previous day's high, low, and range, giving you an immediate snapshot of the market's recent volatility.
//+------------------------------------------------------------------+
//|                                                  camarilladt.mq4 |
//|                      Copyright © 2005, MetaQuotes Software Corp. |
//|                                        http://www.metaquotes.net |
//+------------------------------------------------------------------+
#property copyright "Copyright © 2005, MetaQuotes Software Corp."
#property link      "http://www.metaquotes.net"

#property indicator_chart_window
//---- input parameters
extern int  GMTshift=6;
extern bool pivots = false;
extern bool camarilla = true;
extern bool midpivots = false;
//+------------------------------------------------------------------+
//| Custom indicator initialization function                         |
//+------------------------------------------------------------------+
int init()
  {
//---- indicators
//----
   return(0);
  }
//+------------------------------------------------------------------+
//| Custor indicator deinitialization function                       |
//+------------------------------------------------------------------+
int deinit()
  {
//---- TODO: add your code here
ObjectDelete("R1 Label");
ObjectDelete("R1 Line");
ObjectDelete("R2 Label");
ObjectDelete("R2 Line");
ObjectDelete("R3 Label");
ObjectDelete("R3 Line");
ObjectDelete("S1 Label");
ObjectDelete("S1 Line");
ObjectDelete("S2 Label");
ObjectDelete("S2 Line");
ObjectDelete("S3 Label");
ObjectDelete("S3 Line");
ObjectDelete("P Label");
ObjectDelete("P Line");
ObjectDelete("H5 Label");
ObjectDelete("H5 Line");
ObjectDelete("H4 Label");
ObjectDelete("H4 Line");
ObjectDelete("H3 Label");
ObjectDelete("H3 Line");
ObjectDelete("L3 Label");
ObjectDelete("L3 Line");
ObjectDelete("L4 Label");
ObjectDelete("L4 Line");
ObjectDelete("L5 Label");
ObjectDelete("L5 Line");
ObjectDelete("M5 Label");
ObjectDelete("M5 Line");
ObjectDelete("M4 Label");
ObjectDelete("M4 Line");
ObjectDelete("M3 Label");
ObjectDelete("M3 Line");
ObjectDelete("M2 Label");
ObjectDelete("M2 Line");
ObjectDelete("M1 Label");
ObjectDelete("M1 Line");
ObjectDelete("M0 Label");
ObjectDelete("M0 Line");
//----
   return(0);
  }
//+------------------------------------------------------------------+
//| Custom indicator iteration function                              |
//+------------------------------------------------------------------+
int start()
  {
   int    counted_bars=IndicatorCounted();
//---- TODO: add your code here
double day_high=0;
double day_low=0;
double yesterday_high=0;
double yesterday_open=0;
double yesterday_low=0;
double yesterday_close=0;
double today_open=0;
double ch1=0;
double ch2=0;
double ch3=0;
double ch4=0;
double cl1=0;
double cl2=0;
double cl3=0;
double cl4=0;
double D1=0.091667;
double D2=0.183333;
double D3=0.2750;
double D4=0.55;
double P=0,Q=0,S=0,R=0,M2=0,M3=0,S1=0,R1=0,M1=0,M4=0,S2=0,R2=0,M0=0,M5=0,S3=0,R3=0,L3=0,L4=0,H3=0,H4=0,nQ=0,nD=0,D=0;
double ch5=0;
double cl5=0;
//double D1=0.083333;
//double D2=0.166666;
//double D3=0.25;
//double D4=0.5;

int cnt=720;
double cur_day=0;
double prev_day=0;

double rates_d1[2][6];

//---- exit if period is greater than daily charts
if(Period() > 1440)
{
Print("Error - Chart period is greater than 1 day.");
return(-1); // then exit
}

//---- Get new daily prices & calculate pivots

while (cnt!= 0)
{
	cur_day = TimeDay(Time[cnt]- (GMTshift*3600));

	if (prev_day != cur_day)
	{
		yesterday_close = Close[cnt+1];
		today_open = Open[cnt];
		yesterday_high = day_high;
		yesterday_low = day_low;

		day_high = High[cnt];
		day_low  = Low[cnt];

		prev_day = cur_day;
	}

   if (High[cnt]>day_high)
   {
      day_high = High[cnt];
   }
   if (Low[cnt]<day_low)
   {
      day_low = Low[cnt];
   }

//	SetIndexValue(cnt, 0);
	cnt--;

}


D = (day_high - day_low);
Q = (yesterday_high - yesterday_low);
//------ Pivot Points ------

P = (yesterday_high + yesterday_low + yesterday_close)/3;//Pivot
R1 = (2*P)-yesterday_low;
S1 = (2*P)-yesterday_high;
R2 = P-S1+R1;
S2 = P-R1+S1;
R3 = (2*P)+(yesterday_high-(2*yesterday_low));
S3 = (2*P)-((2* yesterday_high)-yesterday_low);
M0 = (S2+S3)/2;
M1 = (S1+S2)/2;
M2 = (P+S1)/2;
M3 = (P+R1)/2;
M4 = (R1+R2)/2;
M5 = (R2+R3)/2;
//---- To display all 8 Camarilla pivots remove comment symbols below and
// add the appropriate object functions below
ch5 = (yesterday_high/yesterday_low)*yesterday_close;
ch4 = ((yesterday_high - yesterday_low)* D4) + yesterday_close;
ch3 = ((yesterday_high - yesterday_low)* D3) + yesterday_close;
//ch2 = ((yesterday_high - yesterday_low) * D2) + yesterday_close;
//ch1 = ((yesterday_high - yesterday_low) * D1) + yesterday_close;

//cl1 = yesterday_close - ((yesterday_high - yesterday_low)*(D1));
//cl2 = yesterday_close - ((yesterday_high - yesterday_low)*(D2));
cl3 = yesterday_close - ((yesterday_high - yesterday_low)*(D3));
cl4 = yesterday_close - ((yesterday_high - yesterday_low)*(D4));
cl5 = yesterday_close - (ch5 - yesterday_close);


//comment on OHLC and daily range

if (Q > 5)
{
	nQ = Q;
}
else
{
	nQ = Q*10000;
}

if (D > 5)
{
	nD = D;
}
else
{
	nD = D*10000;
}


Comment("High= ",yesterday_high,"    Previous Days Range= ",nQ,"\nLow= ",yesterday_low,"    Current Days Range= ",nD,"\nClose= ",yesterday_close,"   CONCENTRATE AND GOOD HUNTING");

//---- Set line labels on chart window
 if (pivots==true)
   {
if(ObjectFind("R1 label") != 0)
      {
      ObjectCreate("R1 label", OBJ_TEXT, 0, Time[0], R1);
      ObjectSetText("R1 label", " R1", 8, "Arial", EMPTY);
      }
      else
      {
      ObjectMove("R1 label", 0, Time[0], R1);
      }

      if(ObjectFind("R2 label") != 0)
      {
      ObjectCreate("R2 label", OBJ_TEXT, 0, Time[20], R2);
      ObjectSetText("R2 label", " R2", 8, "Arial", EMPTY);
      }
      else
      {
      ObjectMove("R2 label", 0, Time[20], R2);
      }

      if(ObjectFind("R3 label") != 0)
      {
      ObjectCreate("R3 label", OBJ_TEXT, 0, Time[20], R3);
      ObjectSetText("R3 label", " R3", 8, "Arial", EMPTY);
      }
      else
      {
      ObjectMove("R3 label", 0, Time[20], R3);
      }

      if(ObjectFind("P label") != 0)
      {
      ObjectCreate("P label", OBJ_TEXT, 0, Time[0], P);
      ObjectSetText("P label", "Pivot  " +DoubleToStr(P,4), 8, "Arial", EMPTY);
      }
      else
      {
      ObjectMove("P label", 0, Time[0], P);
      }

      if(ObjectFind("S1 label") != 0)
      {
      ObjectCreate("S1 label", OBJ_TEXT, 0, Time[0], S1);
      ObjectSetText("S1 label", "S1", 8, "Arial", EMPTY);
      }
      else
      {
      ObjectMove("S1 label", 0, Time[0], S1);
      }

      if(ObjectFind("S2 label") != 0)
      {
      ObjectCreate("S2 label", OBJ_TEXT, 0, Time[20], S2);
      ObjectSetText("S2 label", "S2", 8, "Arial", EMPTY);
      }
      else
      {
      ObjectMove("S2 label", 0, Time[20], S2);
      }

      if(ObjectFind("S3 label") != 0)
      {
      ObjectCreate("S3 label", OBJ_TEXT, 0, Time[20], S3);
      ObjectSetText("S3 label", "S3", 8, "Arial", EMPTY);
      }
      else
      {
      ObjectMove("S3 label", 0, Time[20], S3);
      }

//---  Draw  Pivot lines on chart
      if(ObjectFind("S1 line") != 0)
      {
      ObjectCreate("S1 line", OBJ_HLINE, 0, Time[40], S1);
      ObjectSet("S1 line", OBJPROP_STYLE, STYLE_DASHDOTDOT);
      ObjectSet("S1 line", OBJPROP_COLOR, MidnightBlue);
      }
      else
      {
      ObjectMove("S1 line", 0, Time[40], S1);
      }

      if(ObjectFind("S2 line") != 0)
      {
      ObjectCreate("S2 line", OBJ_HLINE, 0, Time[40], S2);
      ObjectSet("S2 line", OBJPROP_STYLE, STYLE_DASHDOTDOT);
      ObjectSet("S2 line", OBJPROP_COLOR, MidnightBlue);
      }
      else
      {
      ObjectMove("S2 line", 0, Time[40], S2);
      }

      if(ObjectFind("S3 line") != 0)
      {
      ObjectCreate("S3 line", OBJ_HLINE, 0, Time[40], S3);
      ObjectSet("S3 line", OBJPROP_STYLE, STYLE_DASHDOTDOT);
      ObjectSet("S3 line", OBJPROP_COLOR, MidnightBlue);
      }
      else
      {
      ObjectMove("S3 line", 0, Time[40], S3);
      }

      if(ObjectFind("P line") != 0)
      {
      ObjectCreate("P line", OBJ_HLINE, 0, Time[40], P);
      ObjectSet("P line", OBJPROP_STYLE, STYLE_DOT);
      ObjectSet("P line", OBJPROP_COLOR, Lime);
      }
      else
      {
      ObjectMove("P line", 0, Time[40], P);
      }

      if(ObjectFind("R1 line") != 0)
      {
      ObjectCreate("R1 line", OBJ_HLINE, 0, Time[40], R1);
      ObjectSet("R1 line", OBJPROP_STYLE, STYLE_DASHDOTDOT);
      ObjectSet("R1 line", OBJPROP_COLOR, FireBrick);
      }
      else
      {
      ObjectMove("R1 line", 0, Time[40], R1);
      }

      if(ObjectFind("R2 line") != 0)
      {
      ObjectCreate("R2 line", OBJ_HLINE, 0, Time[40], R2);
      ObjectSet("R2 line", OBJPROP_STYLE, STYLE_DASHDOTDOT);
      ObjectSet("R2 line", OBJPROP_COLOR, FireBrick);
      }
      else
      {
      ObjectMove("R2 line", 0, Time[40], R2);
      }

      if(ObjectFind("R3 line") != 0)
      {
      ObjectCreate("R3 line", OBJ_HLINE, 0, Time[40], R3);
      ObjectSet("R3 line", OBJPROP_STYLE, STYLE_DASHDOTDOT);
      ObjectSet("R3 line", OBJPROP_COLOR, FireBrick);
      }
      else
      {
      ObjectMove("R3 line", 0, Time[40], R3);
      }
}
// --- THE CAMARILLA ---
if (camarilla==true)
   {
   if(ObjectFind("H5 label") != 0)
      {
      ObjectCreate("H5 label", OBJ_TEXT, 0, Time[20], ch5);
      ObjectSetText("H5 label", " H5 LB TARGET", 8, "Arial", EMPTY);
      }
      else
      {
      ObjectMove("H5 label", 0, Time[20], ch5);
      }

      if(ObjectFind("H4 label") != 0)
      {
      ObjectCreate("H4 label", OBJ_TEXT, 0, Time[20], ch4);
      ObjectSetText("H4 label", " H4 LONG BREAKOUT", 8, "Arial", EMPTY);
      }
      else
      {
      ObjectMove("H4 label", 0, Time[20], ch4);
      }

      if(ObjectFind("H3 label") != 0)
      {
      ObjectCreate("H3 label", OBJ_TEXT, 0, Time[20], ch3);
      ObjectSetText("H3 label", " H3 SHORT", 8, "Arial", EMPTY);
      }
      else
      {
      ObjectMove("H3 label", 0, Time[20], ch3);
      }

      if(ObjectFind("L3 label") != 0)
      {
      ObjectCreate("L3 label", OBJ_TEXT, 0, Time[20], cl3);
      ObjectSetText("L3 label", " L3 LONG", 8, "Arial", EMPTY);
      }
      else
      {
      ObjectMove("L3 label", 0, Time[20], cl3);
      }

      if(ObjectFind("L4 label") != 0)
      {
      ObjectCreate("L4 label", OBJ_TEXT, 0, Time[20], cl4);
      ObjectSetText("L4 label", " L4 SHORT BREAKOUT", 8, "Arial", EMPTY);
      }
      else
      {
      ObjectMove("L4 label", 0, Time[20], cl4);
      }

      if(ObjectFind("L5 label") != 0)
      {
      ObjectCreate("L5 label", OBJ_TEXT, 0, Time[20], cl5);
      ObjectSetText("L5 label", " L5 SB TARGET", 8, "Arial", EMPTY);
      }
      else
      {
      ObjectMove("L5 label", 0, Time[20], cl5);
      }

//---- Draw Camarilla lines on Chart
      if(ObjectFind("H5 line") != 0)
      {
      ObjectCreate("H5 line", OBJ_HLINE, 0, Time[40], ch5);
      ObjectSet("H5 line", OBJPROP_STYLE, STYLE_SOLID);
      ObjectSet("H5 line", OBJPROP_COLOR, Green);
      }
      else
      {
      ObjectMove("H5 line", 0, Time[40], ch5);
      }

      if(ObjectFind("H4 line") != 0)
      {
      ObjectCreate("H4 line", OBJ_HLINE, 0, Time[40], ch4);
      ObjectSet("H4 line", OBJPROP_STYLE, STYLE_SOLID);
      ObjectSet("H4 line", OBJPROP_COLOR, Green);
      }
      else
      {
      ObjectMove("H4 line", 0, Time[40], ch4);
      }

      if(ObjectFind("H3 line") != 0)
      {
      ObjectCreate("H3 line", OBJ_HLINE, 0, Time[40], ch3);
      ObjectSet("H3 line", OBJPROP_STYLE, STYLE_SOLID);
      ObjectSet("H3 line", OBJPROP_COLOR, Green);
      }
      else
      {
      ObjectMove("H3 line", 0, Time[40], ch3);
      }

      if(ObjectFind("L3 line") != 0)
      {
      ObjectCreate("L3 line", OBJ_HLINE, 0, Time[40], cl3);
      ObjectSet("L3 line", OBJPROP_STYLE, STYLE_SOLID);
      ObjectSet("L3 line", OBJPROP_COLOR, Red);
      }
      else
      {
      ObjectMove("L3 line", 0, Time[40], cl3);
      }

      if(ObjectFind("L4 line") != 0)
      {
      ObjectCreate("L4 line", OBJ_HLINE, 0, Time[40], cl4);
      ObjectSet("L4 line", OBJPROP_STYLE, STYLE_SOLID);
      ObjectSet("L4 line", OBJPROP_COLOR, Red);
      }
      else
      {
      ObjectMove("L4 line", 0, Time[40], cl4);
      }

      if(ObjectFind("L5 line") != 0)
      {
      ObjectCreate("L5 line", OBJ_HLINE, 0, Time[40], cl5);
      ObjectSet("L5 line", OBJPROP_STYLE, STYLE_SOLID);
      ObjectSet("L5 line", OBJPROP_COLOR, Red);
      }
      else
      {
      ObjectMove("L5 line", 0, Time[40], cl5);
      }
}
//---- Draw Midpoint Pivots on Chart
 if (midpivots==true)
   {
      if(ObjectFind("M5 label") != 0)
      {
      ObjectCreate("M5 label", OBJ_TEXT, 0, Time[20], M5);
      ObjectSetText("M5 label", " M5", 8, "Arial", EMPTY);
      }
      else
      {
      ObjectMove("M5 label", 0, Time[20], M5);
      }

      if(ObjectFind("M4 label") != 0)
      {
      ObjectCreate("M4 label", OBJ_TEXT, 0, Time[20], M4);
      ObjectSetText("M4 label", " M4", 8, "Arial", EMPTY);
      }
      else
      {
      ObjectMove("M4 label", 0, Time[20], M4);
      }

      if(ObjectFind("M3 label") != 0)
      {
      ObjectCreate("M3 label", OBJ_TEXT, 0, Time[20], M3);
      ObjectSetText("M3 label", " M3", 8, "Arial", EMPTY);
      }
      else
      {
      ObjectMove("M3 label", 0, Time[20], M3);
      }

      if(ObjectFind("M2 label") != 0)
      {
      ObjectCreate("M2 label", OBJ_TEXT, 0, Time[20], M2);
      ObjectSetText("M2 label", " M2", 8, "Arial", EMPTY);
      }
      else
      {
      ObjectMove("M2 label", 0, Time[20], M2);
      }

      if(ObjectFind("M1 label") != 0)
      {
      ObjectCreate("M1 label", OBJ_TEXT, 0, Time[20], M1);
      ObjectSetText("M1 label", " M1", 8, "Arial", EMPTY);
      }
      else
      {
      ObjectMove("M1 label", 0, Time[20], M1);
      }

      if(ObjectFind("M0 label") != 0)
      {
      ObjectCreate("M0 label", OBJ_TEXT, 0, Time[20], M0);
      ObjectSetText("M0 label", " M0", 8, "Arial", EMPTY);
      }
      else
      {
      ObjectMove("M0 label", 0, Time[20], M0);
      }


      if(ObjectFind("M5 line") != 0)
      {
      ObjectCreate("M5 line", OBJ_HLINE, 0, Time[40], M5);
      ObjectSet("M5 line", OBJPROP_STYLE, STYLE_DASHDOTDOT);
      ObjectSet("M5 line", OBJPROP_COLOR, EMPTY);
      }
      else
      {
      ObjectMove("M5 line", 0, Time[40], M5);
      }

      if(ObjectFind("M4 line") != 0)
      {
      ObjectCreate("M4 line", OBJ_HLINE, 0, Time[40], M4);
      ObjectSet("M4 line", OBJPROP_STYLE, STYLE_DASHDOTDOT);
      ObjectSet("M4 line", OBJPROP_COLOR, EMPTY);
      }
      else
      {
      ObjectMove("M4 line", 0, Time[40], M4);
      }

      if(ObjectFind("M3 line") != 0)
      {
      ObjectCreate("M3 line", OBJ_HLINE, 0, Time[40], M3);
      ObjectSet("M3 line", OBJPROP_STYLE, STYLE_DASHDOTDOT);
      ObjectSet("M3 line", OBJPROP_COLOR, EMPTY);
      }
      else
      {
      ObjectMove("M3 line", 0, Time[40], M3);
      }

      if(ObjectFind("M2 line") != 0)
      {
      ObjectCreate("M2 line", OBJ_HLINE, 0, Time[40], M2);
      ObjectSet("M2 line", OBJPROP_STYLE, STYLE_DASHDOTDOT);
      ObjectSet("M2 line", OBJPROP_COLOR, EMPTY);
      }
      else
      {
      ObjectMove("M2 line", 0, Time[40], M2);
      }

      if(ObjectFind("M1 line") != 0)
      {
      ObjectCreate("M1 line", OBJ_HLINE, 0, Time[40], M1);
      ObjectSet("M1 line", OBJPROP_STYLE, STYLE_DASHDOTDOT);
      ObjectSet("M1 line", OBJPROP_COLOR, EMPTY);
      }
      else
      {
      ObjectMove("M1 line", 0, Time[40], M1);
      }

      if(ObjectFind("M0 line") != 0)
      {
      ObjectCreate("M0 line", OBJ_HLINE, 0, Time[40], M0);
      ObjectSet("M0 line", OBJPROP_STYLE, STYLE_DASHDOTDOT);
      ObjectSet("M0 line", OBJPROP_COLOR, EMPTY);
      }
      else
      {
      ObjectMove("M0 line", 0, Time[40], M0);
      }
}
//---- done

//----
   return(0);
  }
//+------------------------------------------------------------------+
Comments