AO-Esp-MTF_v1.2
Download script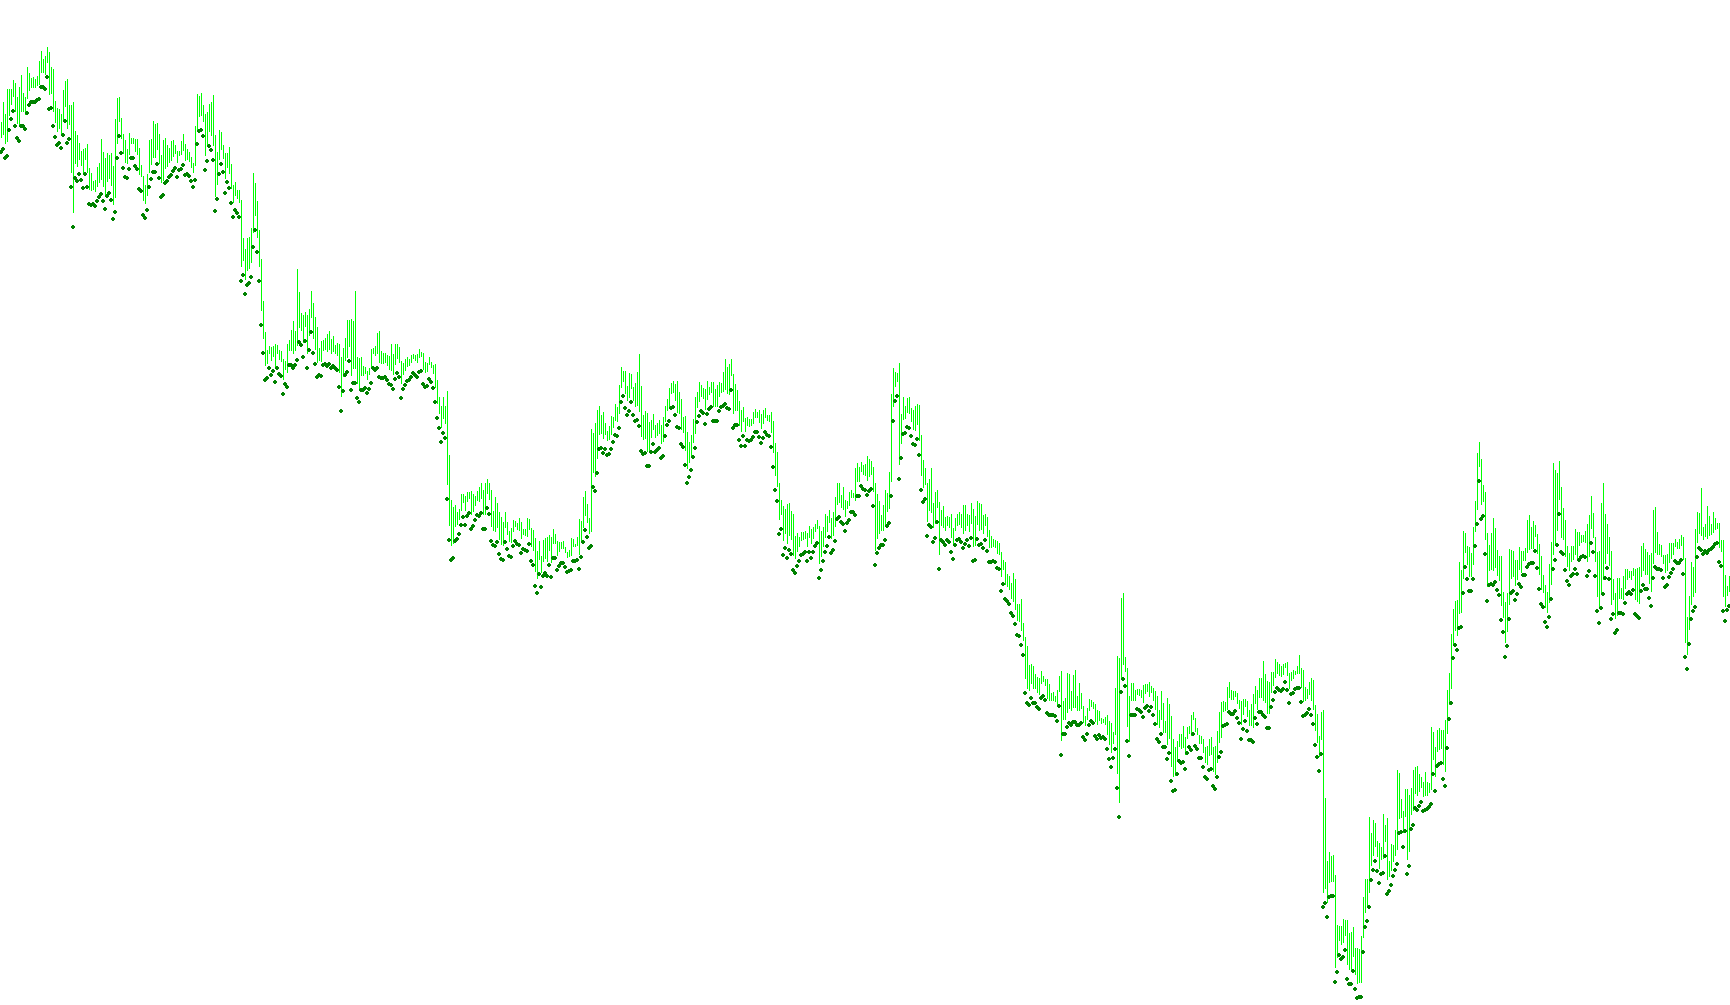
The AO-Esp-MTF is a custom technical analysis tool designed for the MetaTrader 4 platform. It functions by combining multi-timeframe analysis with momentum tracking to help traders identify trend directions and potential exhaustion points.
Core Functionality
At its heart, this script calculates a variation of the "Awesome Oscillator." It does this by measuring the difference between two moving averages: a fast-moving average (which reacts quickly to price changes) and a slow-moving average (which tracks the broader trend). By subtracting the slow average from the fast one, the tool highlights the current momentum of the market.
Key Features
- Multi-Timeframe Analysis: One of the primary strengths of this script is its ability to view data from different timeframes simultaneously. While you may be looking at a 1-minute chart, the indicator can be set to pull and display data from higher periods (such as 1-hour, 4-hour, or Daily charts). This allows traders to see the "big picture" without switching tabs.
- Customizable Moving Averages: The script gives users significant flexibility in how it calculates trends. You can choose between different types of moving averages—Simple (SMA), Exponential (EMA), Smoothed (SMMA), or Linear Weighted (LWMA)—depending on how much weight you want the tool to give to recent price action versus historical data.
- Visual Momentum Tracking: Instead of just providing a raw number, the script translates the momentum into a visual histogram.
- Green Histograms: Generally represent upward momentum where the current value is higher than the previous one.
- Red Histograms: Represent downward momentum where the current value is lower than the previous one.
- Visual Signal Dots: The script includes an optional visual aid that places dots above or below the price candles. These dots act as markers to highlight specific shifts in trend direction, providing a clear "at-a-glance" signal of when momentum has flipped from bullish to bearish (or vice versa).
How it Works for the Trader
When you apply this script to your chart, it processes historical and real-time data to create a visual representation of market energy. By looking at the height and color of the histogram, a trader can gauge how strong a trend is. Because it incorporates multi-timeframe logic, it helps filter out "noise," allowing the user to see if short-term price movements are supported by larger, long-term trends.
//+------------------------------------------------------------------+
//|                                              AO-Esp-MTF_v1.2.mq4 |
//|                                                          M.Ghods |
//|                                              ghods2004@yahoo.com |
//+------------------------------------------------------------------+
#property  copyright "gheymatha.com"
#property  link      "http://gheymatha.com/showpost.php?p=109626&postcount=26"

//---- indicator settings
#property  indicator_separate_window
#property  indicator_buffers 3
#property  indicator_color1  Black
#property  indicator_color2  Green
#property  indicator_color3  Red

extern int  Time_Frame = 30;
extern int  Fast_MA_Period = 5;
extern int  Fast_MA_Mode = 0;
extern int  Slow_MA_Period = 34;
extern int  Slow_MA_Mode = 0;

extern string  ______Mode_Description______ = "0=SMA ,1=EMA ,2=SMMA ,3=LWMA";
extern bool Plot_Dot = true;
extern int  Dot_Size = 10;
extern int  BarQty = 0;

//---- indicator buffers
double     ExtBuffer0[];
double     ExtBuffer1[];
double     ExtBuffer2[];
string TimeFrameStr;
//+------------------------------------------------------------------+
//| Custom indicator initialization function                         |
//+------------------------------------------------------------------+
int init()
  {
   //---- drawing settings
   SetIndexStyle(0,DRAW_NONE);
   SetIndexStyle(1,DRAW_HISTOGRAM);
   SetIndexStyle(2,DRAW_HISTOGRAM);

   IndicatorDigits(Digits+1);
   SetIndexDrawBegin(0,Slow_MA_Period);
   SetIndexDrawBegin(1,Slow_MA_Period);
   SetIndexDrawBegin(2,Slow_MA_Period);
//---- 3 indicator buffers mapping
   SetIndexBuffer(0,ExtBuffer0);
   SetIndexBuffer(1,ExtBuffer1);
   SetIndexBuffer(2,ExtBuffer2);
//---- name for DataWindow and indicator subwindow label

   if(Time_Frame == 0) Time_Frame = Period();
   switch(Time_Frame)
   {
      case 1 : TimeFrameStr="1Min"; break;
      case 5 : TimeFrameStr="5Min"; break;
      case 15 : TimeFrameStr="15Min"; break;
      case 30 : TimeFrameStr="30Min"; break;
      case 60 : TimeFrameStr="1H"; break;
      case 240 : TimeFrameStr="4H"; break;
      case 1440 : TimeFrameStr="Daily"; break;
      case 10080 : TimeFrameStr="Weekly"; break;
      case 43200 : TimeFrameStr="Monthly"; break;
   }

   IndicatorShortName("AO Esp. MTF ("+TimeFrameStr+")");
   SetIndexLabel(1,NULL);
   SetIndexLabel(2,NULL);
//---- initialization done
   return(0);
  }
//+------------------------------------------------------------------+
//| Custom indicator deinitialization function                       |
//+------------------------------------------------------------------+

int deinit()
  {
  if(Plot_Dot)
  {
   for(int i = ObjectsTotal() - 1; i >= 0; i--)
     {
       string label = ObjectName(i);
       if(StringSubstr(label, 0, 6) != "AO_Esp")
           continue;
       ObjectDelete(label);
     }
   }
   return(0);
  }

//+------------------------------------------------------------------+
//| Awesome Oscillator                                               |
//+------------------------------------------------------------------+
int start()
  {
   int    limit , y=0 , i;
   int    counted_bars=IndicatorCounted();
   double prev,current;
   string objname ;
   double Range = 0 , AvgRange = 0;
   datetime TimeArray[];


   ArrayCopySeries(TimeArray,MODE_TIME,Symbol(),Time_Frame);
if(Plot_Dot)
{
   for (int counter=0 ;counter<=5;counter++)
   {
      AvgRange=AvgRange+MathAbs(High[counter]-Low[counter]);
   }
   Range=AvgRange/10;
}

   if(counted_bars>0) counted_bars--;
   limit=Bars-counted_bars;

   if(BarQty == 0) BarQty = limit;

   for(i=0;i<BarQty;i++)
   {
      if (Time[i]<TimeArray[y]) y++;

      ExtBuffer0[i]=iMA(NULL,Time_Frame,Fast_MA_Period,0,Fast_MA_Mode,PRICE_MEDIAN,y)-iMA(NULL,Time_Frame,Slow_MA_Period,0,Slow_MA_Mode,PRICE_MEDIAN,y);
   }
   bool up=true;
   for(i=BarQty-1; i>=0; i--)
     {
      current=ExtBuffer0[i];
      prev=ExtBuffer0[i+1];
      if(current>prev) up=true;
      if(current<prev) up=false;

      if(!up)
        {
         ExtBuffer2[i]=current;
         ExtBuffer1[i]=0.0;

         if(Plot_Dot)
         {
         objname = "AO_Esp_" + TimeFrameStr + "#" + TimeToStr(Time[i]);
         ObjectCreate(objname , OBJ_TEXT , 0 , Time[i] , High[i] + Range*1.5);
         ObjectSetText(objname , CharToStr(159) , Dot_Size , "Wingdings" , Red);
         }
        }
      else
        {
         ExtBuffer1[i]=current;
         ExtBuffer2[i]=0.0;

         if(Plot_Dot)
         {
         objname = "AO_Esp_" + TimeFrameStr + "#" + TimeToStr(Time[i]);
         ObjectCreate(objname , OBJ_TEXT , 0 , Time[i] , Low[i]-Range);
         ObjectSetText(objname , CharToStr(159) , Dot_Size , "Wingdings" , Green);
         }
        }
     }

//---- done
   return(0);
  }
//+------------------------------------------------------------------+
Comments