Aroon_Horn2_v1
Download script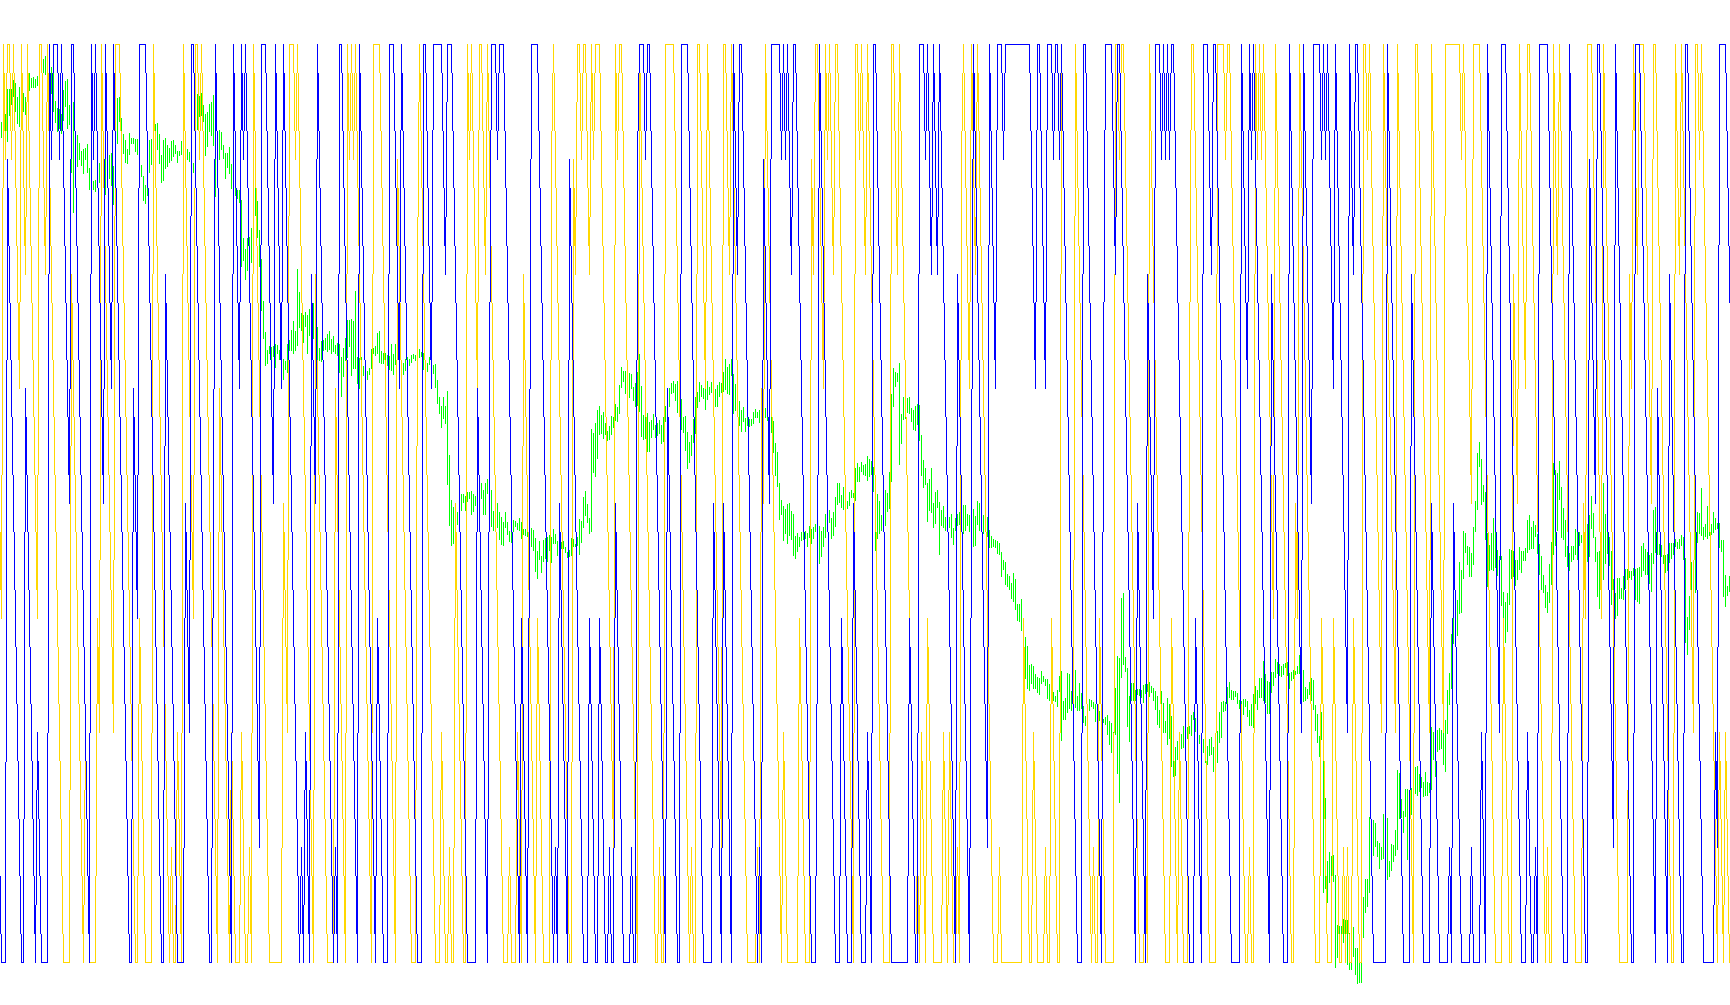
This indicator is designed to help traders visualize market momentum by identifying how recently the price has reached new highs or lows within a specific timeframe. By analyzing these movements, it provides a clear picture of whether the current trend is strengthening in an upward or downward direction.
Core Logic and Functionality
The script operates by examining a user-defined period of historical data (defaulting to 10 candles). It constantly scans this window to locate two key pieces of information: the highest price point reached and the lowest price point reached.
The Momentum Calculation: Instead of just looking at the price values, the logic measures where those high and low points occurred in relation to the current time.
- Upward Momentum (Aroon Up): The tool looks for the most recent peak. If the highest price occurred very recently (close to the current candle), it signifies strong bullish momentum, resulting in a higher value on the indicator.
- Downward Momentum (Aroon Down): Similarly, the tool looks for the most recent valley. If the lowest price occurred very recently, it indicates strong bearish momentum.
Visual Representation
The indicator produces two distinct lines on a separate window in your trading platform:
- Blue Line (Aroon Up): This represents the strength of the upward trend. A high value suggests that the market is consistently pushing toward new highs.
- Red Line (Aroon Down): This represents the strength of the downward trend. A high value suggests that the market is consistently finding new lows.
Trading Insight
By watching the interaction between these two lines, a trader can gauge the "health" of a trend. When one line stays near the top while the other remains low, it confirms a sustained trend in that direction. Conversely, when the lines move toward each other or cross, it can signal a potential shift in momentum or a period of consolidation where neither side has clear dominance.
/*-----------------------------+
|			       |
| Shared by www.Aptrafx.com    |
|			       |
+------------------------------*/

//+------------------------------------------------------------------+
//|                                                   Aroon_Horn.mq4 |
//|                                                tonyc2a@yahoo.com |
//|                                                                  |
//+------------------------------------------------------------------+
#property copyright "tonyc2a@yahoo.com"
#property link      "mailto:tonyc2a@yahoo.com"

#property indicator_separate_window
#property indicator_buffers 2
#property indicator_color1 Blue
#property indicator_color2 Red

extern int Aroon_Period=10;

double Buffer1[];
double Buffer2[];

//+------------------------------------------------------------------+
//| Custom indicator initialization function                         |
//+------------------------------------------------------------------+
int init()
  {
//---- indicators
   SetIndexStyle(0,DRAW_LINE,STYLE_SOLID,1);
   SetIndexBuffer(0,Buffer1);
   SetIndexLabel(0,"Aroon Up");
   SetIndexStyle(1,DRAW_LINE,STYLE_SOLID,1);
   SetIndexBuffer(1,Buffer2);
   SetIndexLabel(1,"Aroon Down");

//----
   return(0);
  }
//+------------------------------------------------------------------+
//| Custor indicator deinitialization function                       |
//+------------------------------------------------------------------+
int deinit()
  {
//---- TODO: add your code here

//----
   return(0);
  }
//+------------------------------------------------------------------+
//| Custom indicator iteration function                              |
//+------------------------------------------------------------------+
int start()
  {
//---- TODO: add your code here
   double HighestBar,LowestBar,aroonUp,aroonDn;
   for(int shift=Bars-Aroon_Period;shift>=0;shift--){
      HighestBar = Highest(Symbol(),0,MODE_HIGH,Aroon_Period-1,shift);
      LowestBar = Lowest(Symbol(),0,MODE_LOW,Aroon_Period-1,shift);

      aroonUp = 100 - ((HighestBar - shift) / Aroon_Period) * 100;
      aroonDn = 100 - ((LowestBar - shift) / Aroon_Period) * 100;

      if(aroonUp == 0) { aroonUp = 0.0000001; }
      if(aroonDn == 0) { aroonDn = 0.0000001; }

      Buffer1[shift]=aroonUp;
      Buffer2[shift]=aroonDn;

      }

//----
   return(0);
  }
//+------------------------------------------------------------------+
Comments