AO_FozzySignal_BT
Download script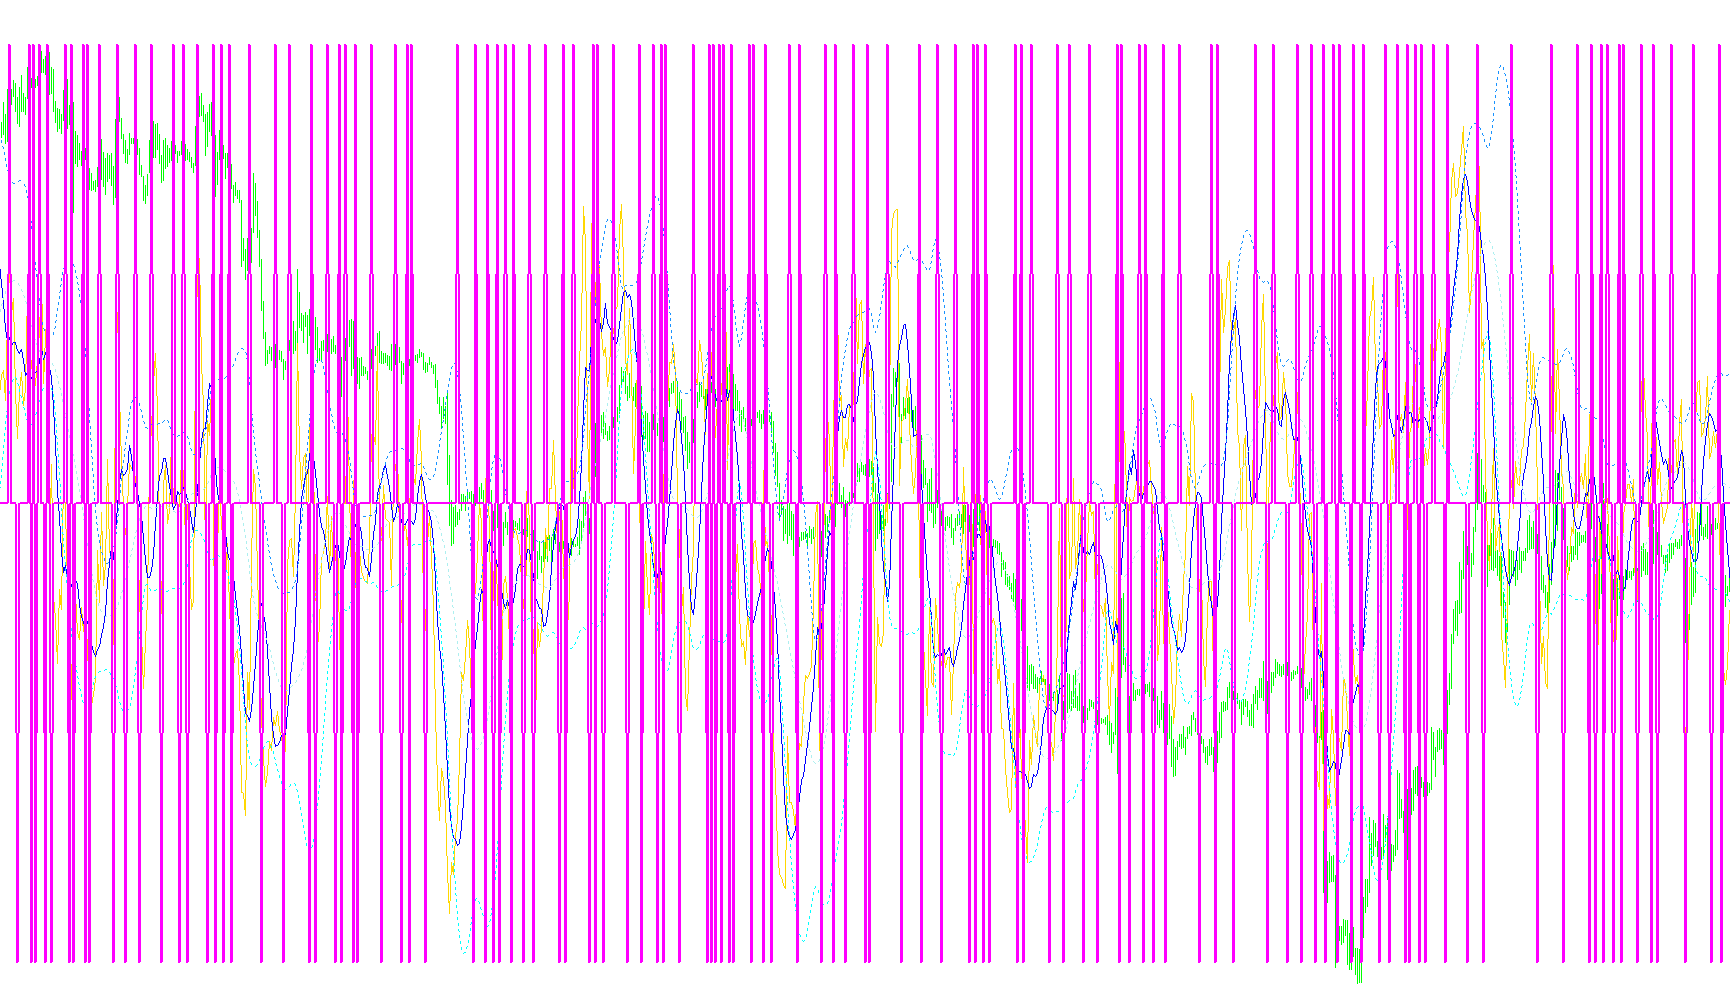
The Fozzy Daily Indicator is a specialized technical analysis tool designed to help traders visualize momentum and potential trend shifts by layering several mathematical filters. Rather than looking at price alone, this script processes data through a series of sequential calculations to "smooth out" market noise and identify specific turning points.
How the Logic Works
The indicator operates through a four-step processing chain:
1. Momentum Measurement (RSI) The process begins by calculating the Relative Strength Index (RSI). This is a standard measure used to determine whether an asset is being overbought or oversold. It essentially looks at the speed and change of price movements over a specific timeframe.
2. Trend Smoothing (RSI Moving Average) To make the momentum data easier to read, the script takes the RSI values and applies a Moving Average to them. This creates a "smoothed" line that helps traders see the general direction of the momentum rather than reacting to every minor spike or dip in price.
3. Volatility Boundaries (Bollinger Bands) The script then takes that smoothed momentum data and wraps it in a Bollinger Band system. Instead of applying these bands to the actual price, they are applied to the smoothed RSI line. This creates a visual "channel" that defines the normal range of volatility for the current momentum trend. If the momentum pushes toward the edges of these bands, it indicates extreme activity.
4. The Signal Mechanism The final output of the script is the "Signal" line. This is the primary tool for the user. The logic behind this signal is based on crossovers:
- Bullish Signals: When the momentum line (RSI) crosses from below to above its smoothed average (RSIMA), the indicator identifies a potential upward shift and triggers a high signal value.
- Bearish Signals: Conversely, when the momentum line crosses from above to below its smoothed average, it identifies a potential downward shift and triggers a low signal value.
Summary for the User
In practical terms, this indicator tells you what the "inner energy" of the market is doing. By smoothing out the RSI and then applying Bollinger Bands to that smoothness, the script filters out "fake" movements. The final Signal line acts as a simplified summary, highlighting specific moments where the momentum has officially flipped direction, helping you spot potential entries or exits more clearly than by watching price alone.
//+------------------------------------------------------------------+
//|                Fozzy Daily Indicator                           |
//|                Programmed by Aidrian O'Connor                  |
//|                http://www.unitone.org            |
//+------------------------------------------------------------------+
#property copyright "Fozzy"
#property link      "http://"

#property indicator_separate_window
#property indicator_buffers 6
#property indicator_color1 Red
#property indicator_color2 Blue
#property indicator_color3 White
#property indicator_color4 White
#property indicator_color5 White
#property indicator_color6 Green

//---- indicator parameters
extern int    RSIPeriod = 8;
extern int    RSIMAPeriod = 8;
extern int    BandsPeriod=20;
extern int    BandsShift=0;
extern double BandsDeviations=2.0;

//---- buffers
double RSI[];
double RSIMA[];
double BBMid[];
double BBUp[];
double BBDn[];
double Signal[];
int i;

int init()
  {

  IndicatorBuffers(6);

//---- drawing settings
   SetIndexStyle(0,DRAW_LINE,STYLE_SOLID);
   SetIndexDrawBegin(0,i-1);
   SetIndexBuffer(0, RSI);
   SetIndexLabel(0,"RSI");

   SetIndexStyle(1,DRAW_LINE,STYLE_SOLID);
   SetIndexDrawBegin(1,i-1);
   SetIndexBuffer(1, RSIMA);
   SetIndexLabel(1,"RSI-MA");

   SetIndexStyle(2,DRAW_LINE,STYLE_DOT);
   SetIndexDrawBegin(2,i-1);
   SetIndexBuffer(2, BBMid);
   SetIndexLabel(2,"BB-Mid");

   SetIndexStyle(3,DRAW_LINE,STYLE_DOT);
   SetIndexDrawBegin(3,i-1);
   SetIndexBuffer(3, BBUp);
   SetIndexLabel(3,"BB-Up");

   SetIndexStyle(4,DRAW_LINE,STYLE_DOT);
   SetIndexDrawBegin(4,i-1);
   SetIndexBuffer(4, BBDn);
   SetIndexLabel(4,"BB-Dn");

   SetIndexStyle(5,DRAW_LINE,STYLE_SOLID,2);
   SetIndexDrawBegin(5,i-1);
   SetIndexBuffer(5, Signal);
   SetIndexLabel(5,"Signal");

   return(0);
  }

int start()
  {
   i=Bars-BandsPeriod;
   while(i>=0) {
     RSI[i] = iRSI(NULL,0,RSIPeriod,PRICE_CLOSE,i);
   i--;
   }

   i=Bars-BandsPeriod;
   while(i>=0) {
     RSIMA[i] = iMAOnArray(RSI,0,RSIMAPeriod,0,MODE_SMA,i);
   i--;
   }

   i=Bars-BandsPeriod;
   while(i>=0) {
     BBMid[i] = iMAOnArray(RSIMA,0,BandsPeriod,BandsShift,MODE_SMA,i);
     BBUp[i] = iBandsOnArray(RSIMA,0,BandsPeriod,BandsDeviations,BandsShift,MODE_UPPER,i);
     BBDn[i] = iBandsOnArray(RSIMA,0,BandsPeriod,BandsDeviations,BandsShift,MODE_LOWER,i);
   i--;
   }

   i=Bars-BandsPeriod;
   while(i>=0) {
      Signal[i] = 50;
      if(RSI[i+1]>RSIMA[i+1] && RSI[i+2]<RSIMA[i+2]){
         Signal[i] = 100;
/*         if(RSIMA[i+1]<BBMid[i+1]){
            Signal[i] = Signal[i]+20;
         }
         if(RSIMA[i+1]<50){
            Signal[i] = Signal[i]+10;
         }
*/
      } else {
         if(RSI[i+1]<RSIMA[i+1] && RSI[i+2]>RSIMA[i+2]){
            Signal[i] = 0;
/*
            if(RSIMA[i+1]>BBMid[i+1]){
               Signal[i] = Signal[i]-20;
            }
            if(RSIMA[i+1]>50){
              Signal[i] = Signal[i]-10;
            }
*/
         }
      }

   i--;
   }
   return(0);
  }

//+------------------------------------------------------------------+
Comments