AO_MFI_MA_Ron_01
Download script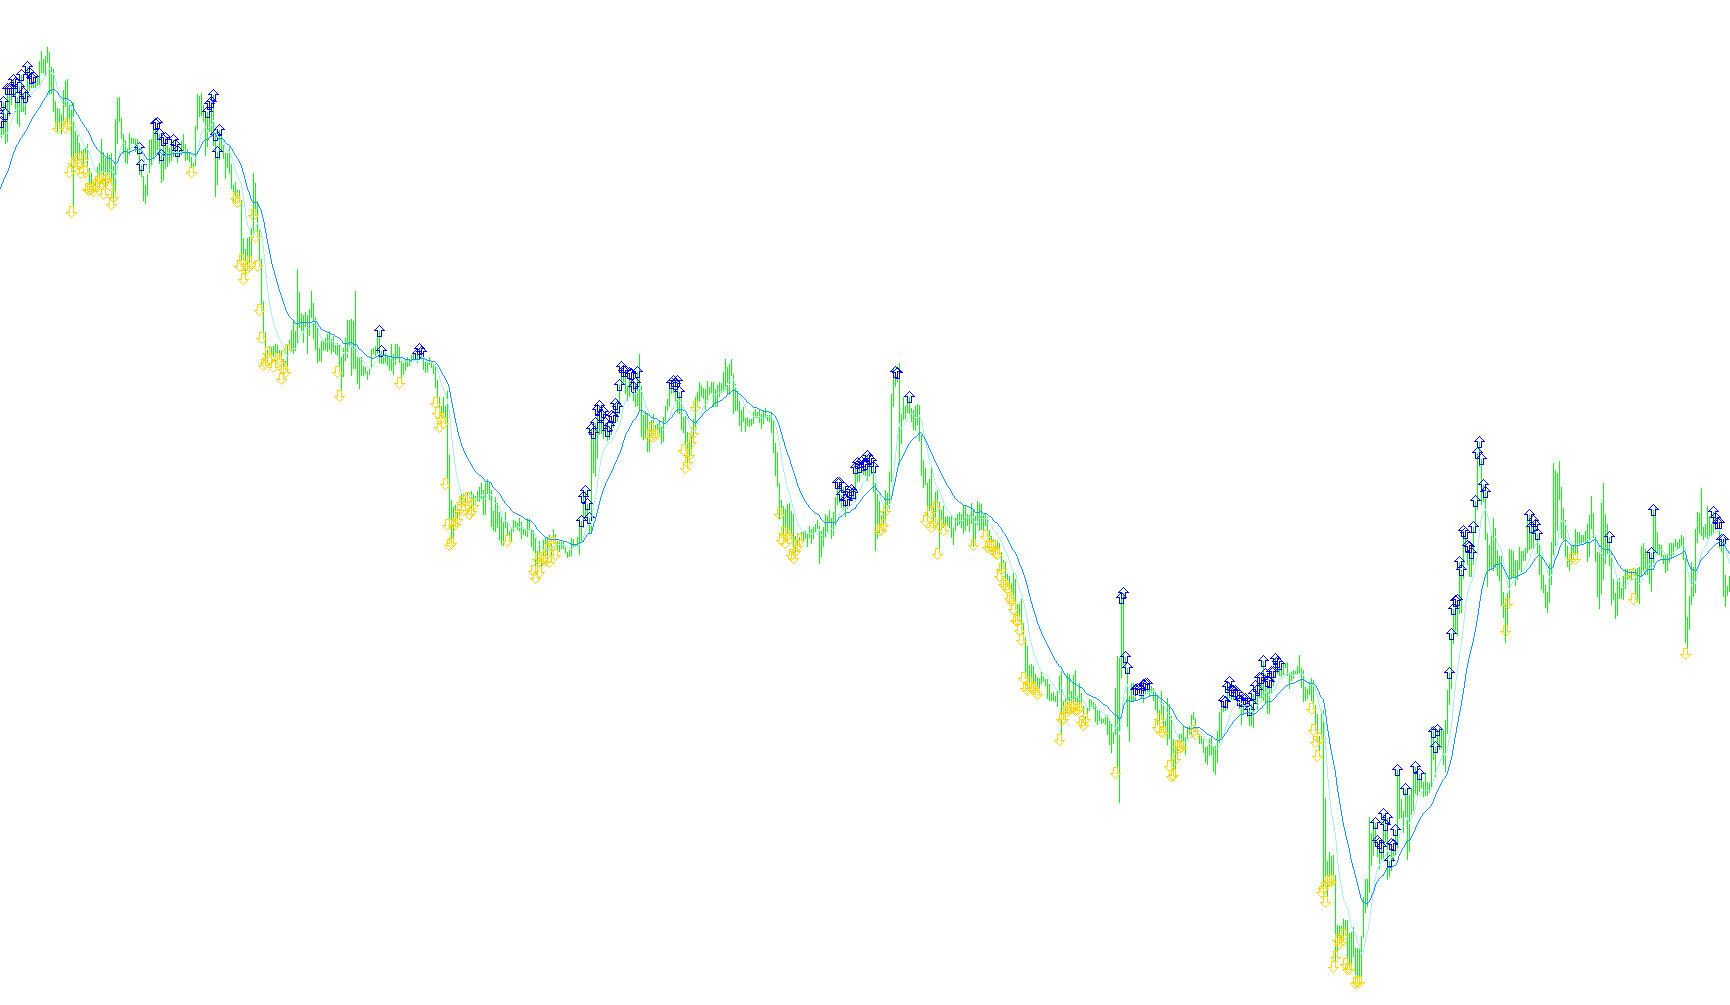
This technical indicator is designed to assist traders in identifying high-probability market trends by combining three distinct types of financial analysis: trend direction, momentum, and volume flow. By synthesizing these three elements, the script attempts to filter out "market noise" and highlight specific areas where price action shows strength or weakness.
Core Components
The logic operates based on three primary analytical tools:
- Exponential Moving Averages (EMA): The script utilizes two different moving averages (set at 8 and 21 periods by default). These act as the visual backbone of the indicator, smoothing out price fluctuations to help establish the general direction of the market.
- Awesome Oscillator (AO): This is a momentum indicator. It measures the difference between two moving averages to determine whether the market is speeding up or slowing down in a specific direction.
- Money Flow Index (MFI): Often described as a "volume-weighted" version of the Relative Strength Index, this component tracks the flow of money into and out of an asset. It helps confirm if the price movement is being supported by actual trading volume.
How the Logic Works
The script constantly scans historical price data to calculate these three values simultaneously. It looks for specific "confluences"—moments where multiple conditions are met at once—to generate visual signals on your chart:
1. Bullish (Buy) Signals For a bullish signal to appear, the script looks for a "perfect storm" of positive momentum and volume:
- The Momentum (AO) must be above zero (indicating upward strength).
- The Money Flow Index (MFI) must be at or above 60 (indicating strong buying pressure). When both conditions are met, the script places a visual marker on the chart to notify the user of potential upward movement.
2. Bearish (Sell) Signals Conversely, for a bearish signal to appear, the script looks for evidence of significant selling pressure:
- The Momentum (AO) must be below zero (indicating downward strength).
- The Money Flow Index (MFI) must be at or below 40 (indicating heavy selling pressure). When these conditions align, the script places a visual marker to highlight potential downward movement.
Summary for the User
Instead of relying on a single indicator—which can often provide "false positives"—this script requires three different mathematical models to agree before showing you a signal. It essentially acts as a filter: it waits for the trend to be clear, the momentum to be strong, and the volume to back up the move before highlighting a potential entry point on your trading screen.
//+------------------------------------------------------------------+
//| MA + MFI + AO                               |
//+------------------------------------------------------------------+
#property copyright "Ron T"
#property link      "http://www.lightpatch.com/forex"

#property indicator_chart_window
#property indicator_buffers 5

#property indicator_color1 Red
#property indicator_color2 White

#property indicator_color3 Aqua
#property indicator_color4 LightGreen

#property indicator_color5 DodgerBlue

extern int MovingAvg1=8;
extern int MovingAvg2=21;
extern int MFIPeriod=14;

//---- buffers
double Buffer0[];
double Buffer1[];
double Buffer2[];
double Buffer3[];
double Buffer4[];


//+------------------------------------------------------------------+
//| Custom indicator initialization function                         |
//|------------------------------------------------------------------|

int init()
  {
   // 233 up arrow
   // 234 down arrow
   // 241 hollow up
   // 242 hollow down
   // 159 big dot
   // 158 little dot
   // 168 open square
   // 120 box with X

   SetIndexStyle(0,DRAW_ARROW);
   SetIndexBuffer(0, Buffer0);
   SetIndexArrow(0,242);

   SetIndexStyle(1,DRAW_ARROW);
   SetIndexBuffer(1, Buffer1);
   SetIndexArrow(1,241);

   SetIndexStyle(2,DRAW_LINE);
   SetIndexBuffer(2, Buffer2);

   SetIndexStyle(3,DRAW_LINE);
   SetIndexBuffer(3, Buffer3);

   SetIndexStyle(4,DRAW_LINE);
   SetIndexBuffer(4, Buffer4);

   return(0);
  }


//+------------------------------------------------------------------+
//| Custor indicator deinitialization function                       |
//+------------------------------------------------------------------+
int deinit()
  {
   int i;

   for( i=0; i<Bars; i++ ) Buffer0[i]=0;
   for( i=0; i<Bars; i++ ) Buffer1[i]=0;
   for( i=0; i<Bars; i++ ) Buffer2[i]=0;
   for( i=0; i<Bars; i++ ) Buffer3[i]=0;
   for( i=0; i<Bars; i++ ) Buffer4[i]=0;

   return(0);
  }


//+------------------------------------------------------------------+
//| Custom indicator iteration function                              |
//+------------------------------------------------------------------+


int start()
  {
   int      pos=Bars-100; // leave room for moving average periods
   int      ctr=0;

   double p=Point();

   double  i0, i1, i2, i3, i4;


   while(pos>=0)
     {

      i0=iMA(Symbol(),0,MovingAvg1,0,PRICE_OPEN,MODE_EMA,pos);
      i1=iMA(Symbol(),0,MovingAvg2,0,PRICE_OPEN,MODE_EMA,pos);
      i2=iAO(Symbol(),0,pos);
      i3=iMFI(Symbol(),0,MFIPeriod,pos);

      Buffer2[pos]=i0;
      Buffer3[pos]=i1;

      //Long AO above 0 and MFI above 60
      if (i2>0 && i3>=60)
        {
         Buffer1[pos]=High[pos];
        }

      //Short AO below 0 and MFI below 40
      if (i2<0 && i3<=40)
        {
         Buffer0[pos]=Low[pos];
        }


 	   pos--;
     }

   return(0);
  }
//+------------------------------------------------------------------+
Comments