YANS_IND2_01
Download script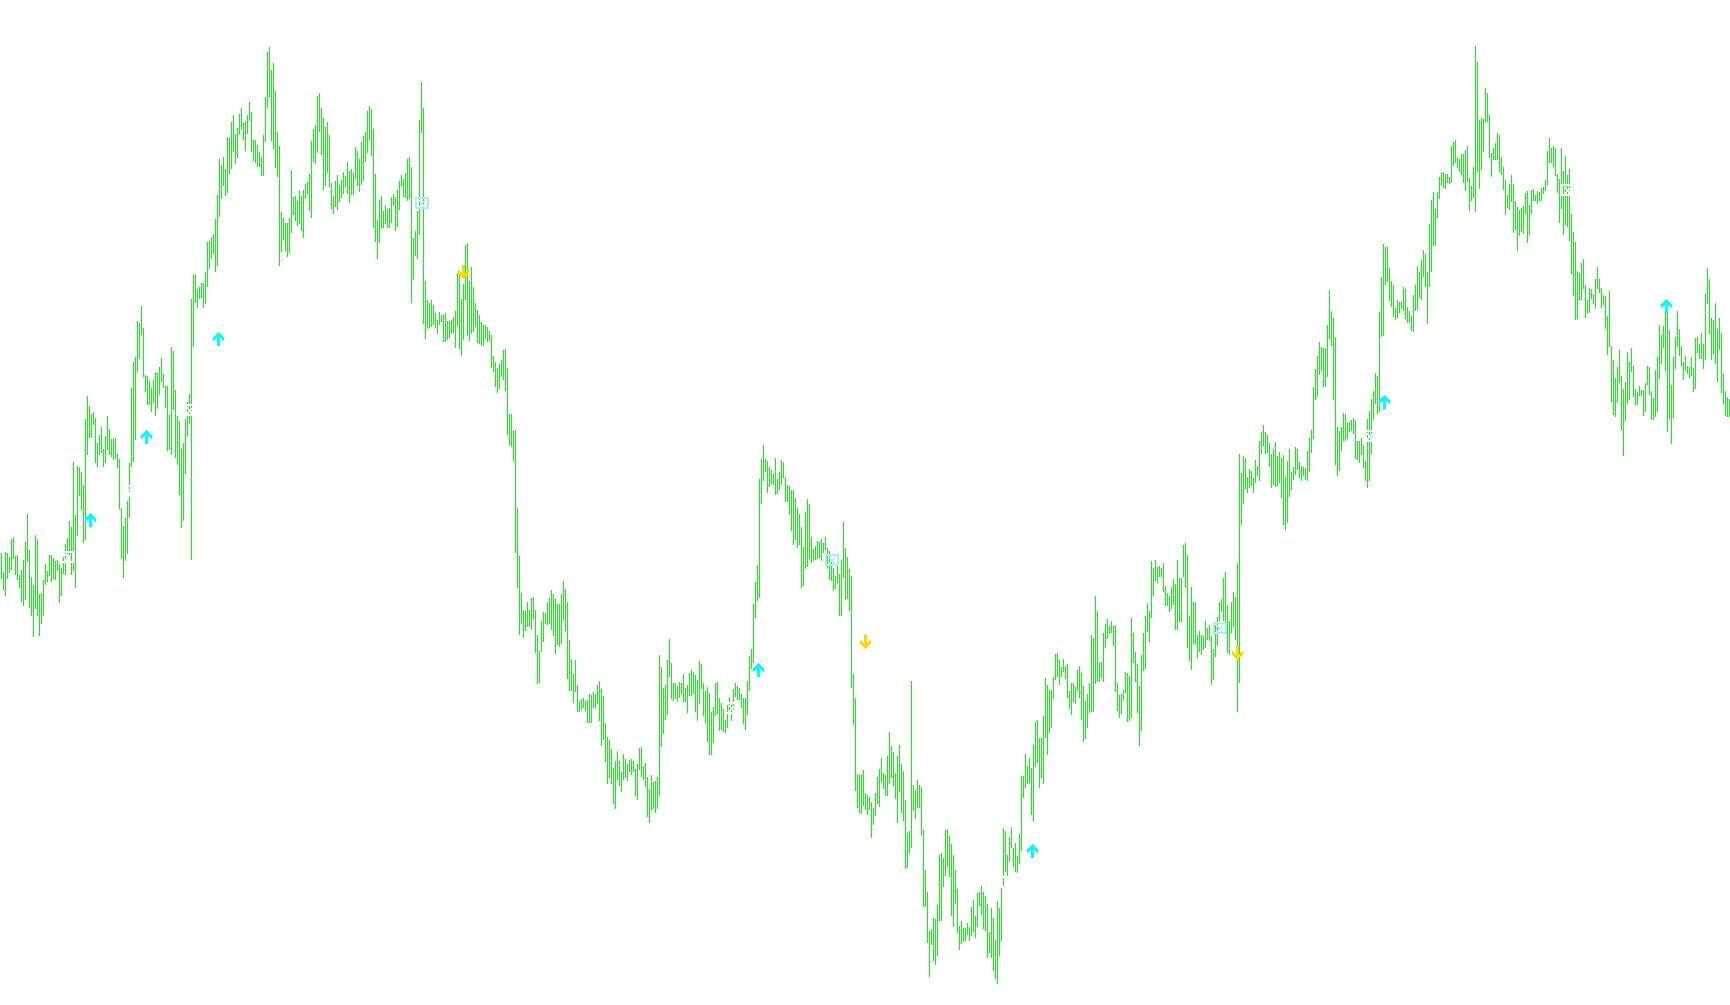
This technical indicator is designed to provide visual signals on a trading chart by analyzing the relationship between three primary market components: short-term momentum, long-term trends, and volatility-based price reversals.
Core Logic Overview
The script monitors how the price moves relative to moving averages and a Parabolic SAR (Stop and Reverse) indicator. Instead of looking at these markers in isolation, it looks for specific "confluences"—moments where multiple technical conditions align simultaneously to suggest a high-probability trend change.
Key Components of the Analysis
The logic operates by tracking three distinct variables:
- Moving Average Crossings: The script tracks two different Exponential Moving Averages (EMAs)—a fast 10-period average and a slower 40-period average. It identifies "crosses," which occur when the fast line moves from below to above (bullish) or above to below (bearish) the slow line.
- Parabolic SAR Position: This is a volatility indicator used to determine the "ceiling" or "floor" of the price. The script monitors whether this indicator is currently trading above or below the actual candle prices.
- The "Flip" Logic: The script specifically watches for "flips"—the exact moment the Parabolic SAR switches from being above the price to below it (or vice versa).
Signal Generation Logic
Rather than drawing a signal every time a line crosses another, the script uses a sophisticated filtering system to ensure the signals are meaningful:
- Trend Validation: The script looks for instances where the Parabolic SAR crosses the 40-period EMA. This helps filter out "noise" and ensures that a trend change is significant enough to be acted upon.
- Timing Delay: It incorporates a unique logic check regarding how many periods have passed since the last Moving Average cross. By requiring a specific duration of movement (a minimum "distance" in time), it prevents the indicator from triggering multiple redundant signals during a single volatile move.
- Visual Feedback: The script translates these complex mathematical intersections into eight distinct visual markers on your chart:
- Arrows and Dots: Used to highlight immediate entry points or trend confirmations.
- Boxes (with X's): These serve as structural markers, identifying specific price levels where a crossover occurred under validated conditions.
Summary for the Trader
In plain terms, this tool acts as a filter. It watches the market 24/7 and only highlights a signal when the short-term momentum (10 EMA), the long-term trend (40 EMA), and the volatility reversal (SAR) all agree that a trend shift is taking place. By doing this, it aims to clear away minor price fluctuations and focus on significant structural moves in the market.
/*-----------------------------+
|			       |
| Shared by www.Aptrafx.com    |
|			       |
+------------------------------*/

//+------------------------------------------------------------------+
//|                                                                  |
//+------------------------------------------------------------------+
#property copyright "Ron T"
#property link      "http://www.lightpatch.com"

#property indicator_chart_window
#property indicator_buffers 8

#property indicator_color1 Red
#property indicator_color2 Red
#property indicator_color3 Red
#property indicator_color4 Red

#property indicator_color5 White
#property indicator_color6 White
#property indicator_color7 White
#property indicator_color8 White


//---- buffers
double Buffer1[];
double Buffer2[];
double Buffer3[];
double Buffer4[];
double Buffer5[];
double Buffer6[];
double Buffer7[];
double Buffer8[];


// User Input


//+------------------------------------------------------------------+
//| Custom indicator initialization function                         |
//|------------------------------------------------------------------|

int init()
  {

   // 233 up arrow
   // 234 down arrow
   // 159 big dot
   // 168 open square
   // 120 box with X

   SetIndexStyle(0,DRAW_ARROW);  //RED ARROW
   SetIndexBuffer(0, Buffer1);
   SetIndexArrow(0,234);

   SetIndexStyle(1,DRAW_ARROW);
   SetIndexBuffer(1, Buffer2);
   SetIndexArrow(1,159);

   SetIndexStyle(2,DRAW_ARROW);  //RED OPEN BOX
   SetIndexBuffer(2, Buffer3);
   SetIndexArrow(2,120);

   SetIndexStyle(3,DRAW_ARROW);  //RED DOT
   SetIndexBuffer(3, Buffer4);
   SetIndexArrow(3,159);

   SetIndexStyle(4,DRAW_ARROW);  //WHITE ARROW
   SetIndexBuffer(4, Buffer5);
   SetIndexArrow(4,233);

   SetIndexStyle(5,DRAW_ARROW);
   SetIndexBuffer(5, Buffer6);
   SetIndexArrow(5,159);

   SetIndexStyle(6,DRAW_ARROW);  //WHITE X BOX
   SetIndexBuffer(6, Buffer7);
   SetIndexArrow(6,120);

   SetIndexStyle(7,DRAW_ARROW);  //RED DOT
   SetIndexBuffer(7, Buffer8);
   SetIndexArrow(7,159);

   return(0);
  }


//+------------------------------------------------------------------+
//| Custor indicator deinitialization function                       |
//+------------------------------------------------------------------+
int deinit()
  {
   int i;

   for( i=0; i<Bars; i++ ) Buffer1[i]=0;
   for( i=0; i<Bars; i++ ) Buffer2[i]=0;
   for( i=0; i<Bars; i++ ) Buffer3[i]=0;
   for( i=0; i<Bars; i++ ) Buffer4[i]=0;
   for( i=0; i<Bars; i++ ) Buffer5[i]=0;
   for( i=0; i<Bars; i++ ) Buffer6[i]=0;
   for( i=0; i<Bars; i++ ) Buffer7[i]=0;
   for( i=0; i<Bars; i++ ) Buffer8[i]=0;

   return(0);
  }


//+------------------------------------------------------------------+
//| Custom indicator iteration function                              |
//+------------------------------------------------------------------+
int start()
  {
   int      pos=Bars-100; // leave room for moving average periods

   double   cEMA10=0, pEMA10=0;
   double   cEMA40=0, pEMA40=0;
   double   cSAR=0,   pSAR=10;

   int      lastcross=0;
   double   lastlevel=0;

   bool      rising=false;
   bool     falling=false;

   bool       sarLO=false;
   bool       sarHI=false;

   bool      flipUP=false;
   bool      flipDN=false;


   int      dCROSS;    // how many periods since last MA cross

   int      above=0;   // how long SAR has been up
   int      below=0;   // how long SAR has been down

   double    p=Point();

   bool      Over=false;
   bool      Under=false;

   bool      onecross=false;


   // 1 RED    DOWN ARROW
   // 2 RED
   // 3 RED    BIG OPEN BOX
   // 4 RED    BIG DOT
   // 5 WHITE  UP ARROW
   // 6 WHITE
   // 7 WHITE  BIG X BOX
   // 8 WHITE  BIG DOT

   while(pos>=0)
     {

      cEMA10=iMA(Symbol(),0,10,0,MODE_EMA,PRICE_CLOSE, pos);
      pEMA10=iMA(Symbol(),0,10,0,MODE_EMA,PRICE_CLOSE, pos+1);
      cEMA40=iMA(Symbol(),0,40,0,MODE_EMA,PRICE_CLOSE, pos);
      pEMA40=iMA(Symbol(),0,40,0,MODE_EMA,PRICE_CLOSE, pos+1);
      cSAR=iSAR(Symbol(),0,0.02,0.2,pos);
      pSAR=iSAR(Symbol(),0,0.02,0.2,pos+1);

      //
      // Set all the switches
      //

      // determine if rising or falling cross
      rising=false;
      if (pEMA10<=pEMA40 && cEMA10>=cEMA40){rising=true; onecross=false;}
      falling=false;
      if (pEMA10>=pEMA40 && cEMA10<=cEMA40){falling=true; onecross=false;}

      // which side is SAR on
      sarLO=false;
      if (cSAR<Low[pos])  sarLO=true;
      sarHI=false;
      if (cSAR>High[pos]) sarHI=true;

      // did PSAR just flip
      flipUP=false;
      if (pSAR<=Low[pos+1] && cSAR>=High[pos]){flipUP=true;}
      flipDN=false;
      if (pSAR>=High[pos+1] && cSAR<=Low[pos]){flipDN=true;}


      //
      // Show all the indicators based on switches
      //

      // rising crosses with LOW SAR ONLY
      //Buffer7[pos]=cEMA10;
      if (rising){lastcross=pos; lastlevel=cEMA10; above=0; below=0; dCROSS=0;}  //WHITE BOX
      // falling crosses with HIGH SAR ONLY
      //Buffer3[pos]=cEMA10;
      if (falling){lastcross=pos; lastlevel=cEMA10; above=0; below=0; dCROSS=0;} //RED BOX

      //SAR crossed above EMA40
      if (pSAR<pEMA40 && cSAR>=cEMA40 && !flipUP && !flipDN)
         {
          if (!onecross && dCROSS>=6) {Buffer7[lastcross]=lastlevel; Buffer5[pos]=cSAR; onecross=true;}
         }
      //SAR crossed below EMA40
      if (pSAR>pEMA40 && cSAR<=cEMA40 && !flipUP && !flipDN)
         {
          if (!onecross && dCROSS>=6) {Buffer3[lastcross]=lastlevel; Buffer1[pos]=cSAR; onecross=true;}
         }

      if  (rising && !onecross) {Buffer7[lastcross]=0; lastcross=pos;}
      if (falling && !onecross) {Buffer3[lastcross]=0; lastcross=pos;}


      //if (sarHI) above++;  // count how long SAR has been up
      //if (sarLO) below++;  // count how long SAR has been down

      //if (flipUP && below<=6){Buffer1[pos]=cSAR;}
      //if (flipDN && above<=6){Buffer5[pos]=cSAR;}


      dCROSS++;
 	   pos--;
     }

   return(0);
  }
//+------------------------------------------------------------------+
Comments