ZAGI
Download script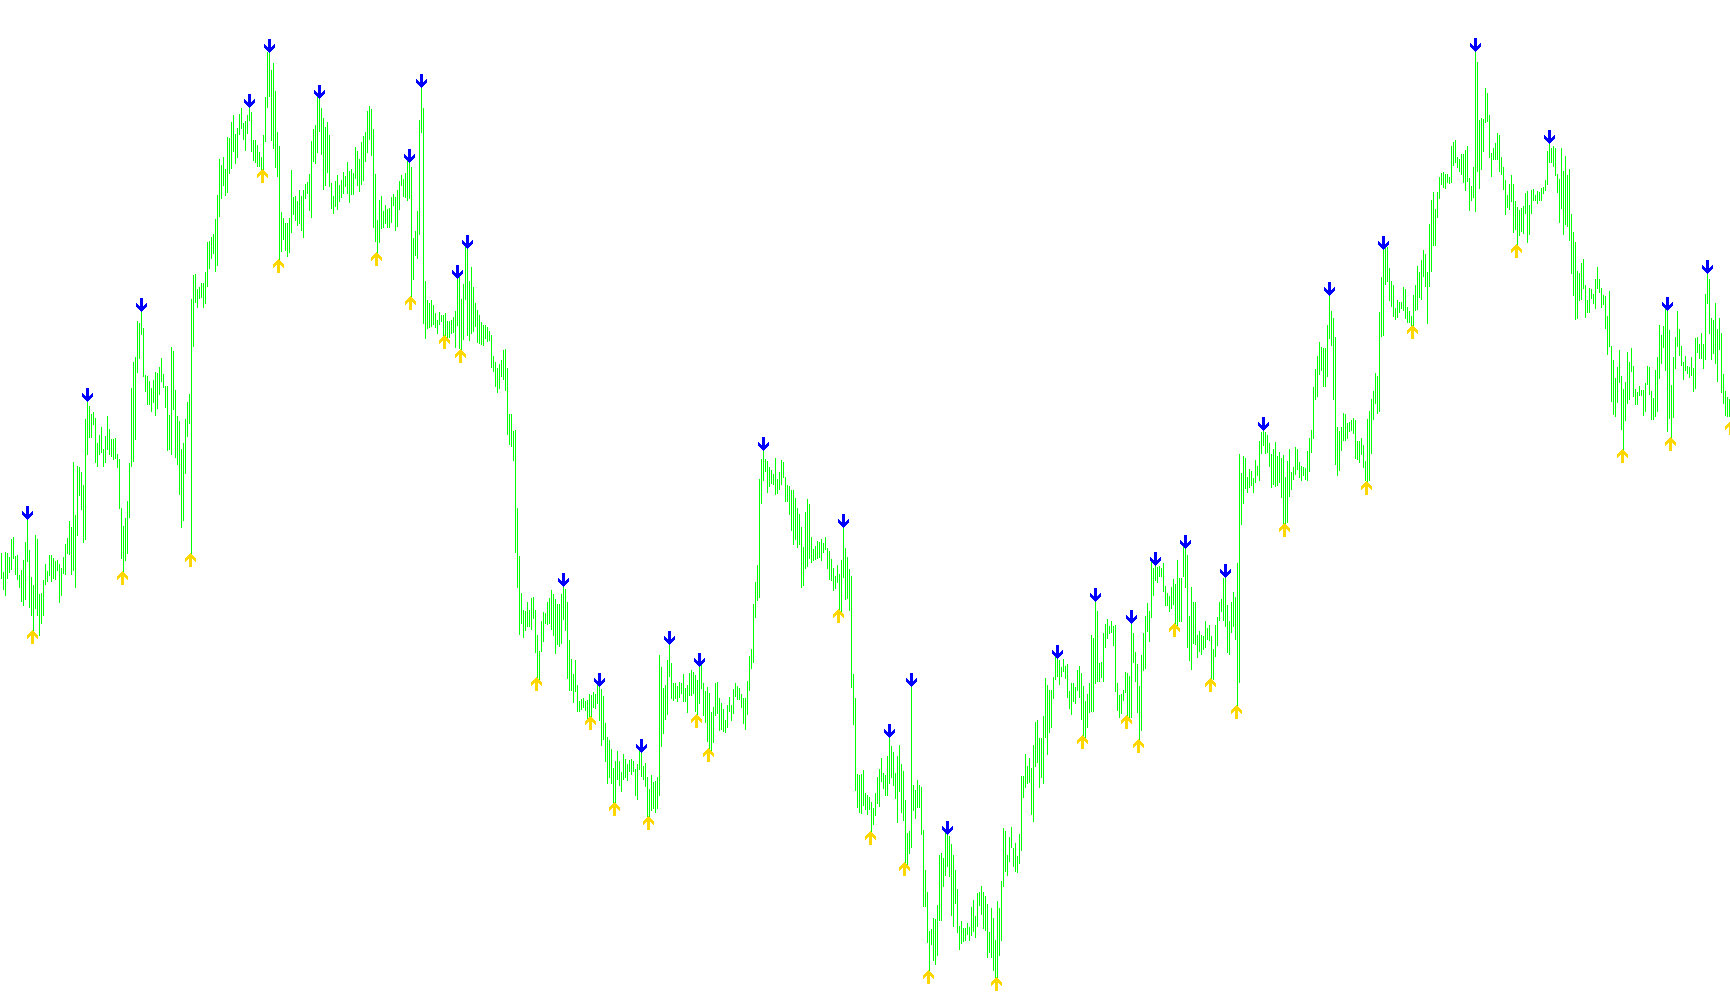
This tool is designed to identify and visualize significant price movements on a trading chart by highlighting key structural turning points. It simplifies the complex fluctuations of the market into a series of "zigzags," helping traders see the overarching trend rather than getting distracted by minor price noise.
How the Logic Works
The script functions by scanning historical price data to identify distinct peaks (highs) and valleys (lows). It uses three primary parameters to determine what qualifies as a significant move:
- Depth: This defines how far back the tool looks to find a high or low point. A larger depth means the tool will focus on major swings, while a smaller depth captures more frequent, minor movements.
- Deviation: This acts as a "filter" for price movement. It ensures that the tool only marks a new point if the price has moved a minimum distance from the previous one. This prevents the indicator from reacting to tiny, insignificant vibrations in the market.
- Backstep: This is used to verify the consistency of a move by checking the immediate surrounding candles, ensuring that a peak or valley isn't just a momentary spike but a sustained structural point.
The Processing Sequence
To create the visual lines you see on your chart, the script performs several layers of analysis:
- Initial Detection: It first scans the price history to find all potential highs and lows that meet your specific Depth, Deviation, and Backstep requirements.
- Refinement & Filtering: The logic then reviews these identified points. If a new high is discovered that is higher than a previously recorded high in the same trend, it "updates" the data. This ensures that only the most extreme price points are kept.
- Final Mapping: Finally, the tool cleans up the data to connect these points logically. It removes any redundant marks so that the resulting visualization clearly shows the flow of the market—moving from peak to valley to peak—providing a clean visual map of price action.
Key Takeaway for Traders
Because this is a "ZigZag" style indicator, it is intended to show structural trends rather than predict immediate entry points. It highlights where the price has reached significant milestones, helping you identify whether the market is currently in an uptrend, a downtrend, or moving sideways.
//+------------------------------------------------------------------+
//|                                   ZigZag Pointer with Alert .mq4 |
//|                                    zigzag modified by Dr. Gaines |
//|                                      dr_richard_gaines@yahoo.com |
//| Zigzag is a unconformed signal so the price may break thru.                                                 |
//|                                        http://www.metaquotes.net |
//+------------------------------------------------------------------+
#property copyright "dr_richard_gaines"
#property link      "http://www.metaquotes.net/"

#property indicator_chart_window
#property indicator_buffers 2
#property indicator_color1 Lime
#property indicator_width1 1
#property indicator_color2 Red
#property indicator_width2 1
//---- indicator parameters
extern int ExtDepth=12;
extern int ExtDeviation=5;
extern int ExtBackstep=3;
//---- indicator buffers
double ExtMapBuffer[];
double ExtMapBuffer2[];

//+------------------------------------------------------------------+
//| Custom indicator initialization function                         |
//+------------------------------------------------------------------+
int init()
  {
   IndicatorBuffers(2);
//---- drawing settings
   SetIndexStyle(0,DRAW_ARROW);
   SetIndexArrow(0, 233);
   SetIndexStyle(1,DRAW_ARROW);
   SetIndexArrow(1, 234);
//---- indicator buffers mapping
   SetIndexBuffer(0,ExtMapBuffer);
   SetIndexBuffer(1,ExtMapBuffer2);
   SetIndexEmptyValue(0,0.0);

//---- indicator short name
   IndicatorShortName("ZigZag("+ExtDepth+","+ExtDeviation+","+ExtBackstep+")");
//---- initialization done
   return(0);
  }
//+------------------------------------------------------------------+
//|                                                                  |
//+------------------------------------------------------------------+
int start()
{
int    shift, back,lasthighpos,lastlowpos;
double val,res;
double curlow,curhigh,lasthigh,lastlow;
for(shift=Bars-ExtDepth; shift>=0; shift--)
{
val=Low[Lowest(NULL,0,MODE_LOW,ExtDepth,shift)];
if(val==lastlow) val=0.0;
else
{
lastlow=val;
if((Low[shift]-val)>(ExtDeviation*Point)) val=0.0;
else
{
for(back=1; back<=ExtBackstep; back++)
{
res=ExtMapBuffer[shift+back];
if((res!=0)&&(res>val)) ExtMapBuffer[shift+back]=0.0;
}
}
}
ExtMapBuffer[shift]=val;
//--- high
val=High[Highest(NULL,0,MODE_HIGH,ExtDepth,shift)];
if(val==lasthigh) val=0.0;
else
{
lasthigh=val;
if((val-High[shift])>(ExtDeviation*Point)) val=0.0;
else
{
for(back=1; back<=ExtBackstep; back++)
{
res=ExtMapBuffer2[shift+back];
if((res!=0)&&(res<val)) ExtMapBuffer2[shift+back]=0.0;
}
}
}
ExtMapBuffer2[shift]=val;
}
// final cutting
lasthigh=-1; lasthighpos=-1;
lastlow=-1;  lastlowpos=-1;
for(shift=Bars-ExtDepth; shift>=0; shift--)
{
curlow=ExtMapBuffer[shift];
curhigh=ExtMapBuffer2[shift];
if((curlow==0)&&(curhigh==0)) continue;
//---
if(curhigh!=0)
{
if(lasthigh>0)
{
if(lasthigh<curhigh) ExtMapBuffer2[lasthighpos]=0;
else ExtMapBuffer2[shift]=0;
}
//---
if(lasthigh<curhigh || lasthigh<0)
{
lasthigh=curhigh;
lasthighpos=shift;
}
lastlow=-1;
}
//----
if(curlow!=0)
{
if(lastlow>0)
{
if(lastlow>curlow) ExtMapBuffer[lastlowpos]=0;
else ExtMapBuffer[shift]=0;
}
//---
if((curlow<lastlow)||(lastlow<0))
{
lastlow=curlow;
lastlowpos=shift;
}
lasthigh=-1;
}
}

for(shift=Bars-1; shift>=0; shift--)
{
if(shift>=Bars-ExtDepth) ExtMapBuffer[shift]=0.0;
else
{
res=ExtMapBuffer2[shift];
if(res!=0.0) ExtMapBuffer2[shift]=res;
}
}
}


//end//
Comments