ytg_TF_RSI
Download script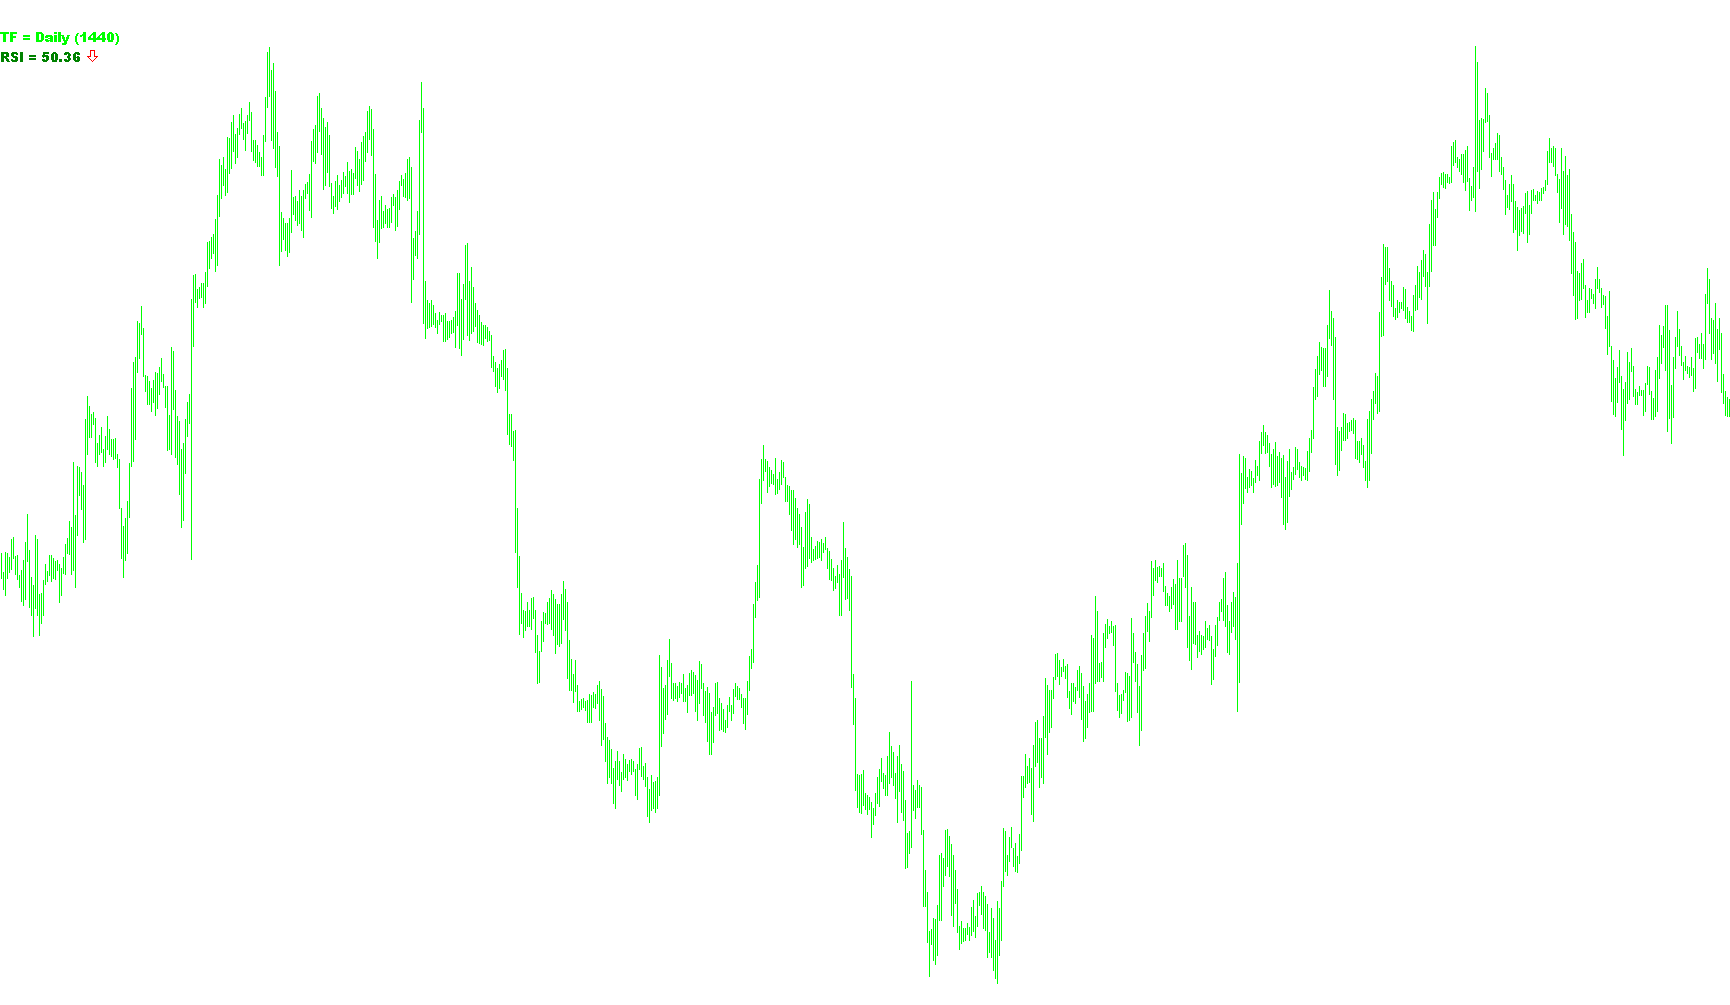
This script is a custom trading indicator designed to provide real-time visual data regarding market momentum and trends directly on your trading chart. It simplifies complex technical analysis into three clear pieces of information: the time frame being analyzed, the current strength of the Relative Strength Index (RSI), and the immediate direction of price movement.
Core Functionality
The logic operates by pulling data from a specific time frame (which can be set by the user) and calculating the Relative Strength Index (RSI). The RSI is a standard momentum oscillator that measures the speed and change of price movements. The script then processes this data to display three distinct visual elements on your screen:
1. Time Frame Identification The tool automatically detects and displays which time frame the calculations are based on. This ensures clarity when you are monitoring multiple assets or using a multi-timeframe analysis strategy, as it confirms exactly what period the current data represents (e.g., Daily, H1, M15, etc.).
2. RSI Sentiment & Strength The script monitors the RSI value relative to a "midpoint" of 50.
- If the RSI is above 50, it indicates bullish momentum, and the text color changes accordingly.
- If the RSI is below 50, it indicates bearish momentum, and the text color shifts to reflect this downward trend.
3. Dynamic Trend Direction (The Arrow) Beyond just looking at the current value, the script compares the current RSI value against the previous bar's RSI value. By calculating the difference between these two points:
- Upward Movement: If the momentum is increasing compared to the previous moment, an upward-pointing symbol (an arrow) appears in green.
- Downward Movement: If the momentum is decreasing compared to the previous moment, a downward-pointing symbol (an arrow) appears in red.
Summary of User Experience
Instead of requiring you to constantly look at a separate RSI window and interpret wavy lines, this script summarizes that information into a compact dashboard on your main chart. It provides an instant "snapshot" of market health: it tells you the time frame, whether the overall trend is currently positive or negative (via color-coded text), and whether the immediate momentum is pushing up or down (via dynamic arrows).
//+------------------------------------------------------------------+
//|                                                   ytg_TF_RSI.mq4 |
//|                                                     Yuriy Tokman |
//|                                            yuriytokman@gmail.com |
//+------------------------------------------------------------------+
#property copyright "Yuriy Tokman"
#property link      "yuriytokman@gmail.com"

#property indicator_chart_window

extern string _____1_____ = "Íàñòðîéêè èíäèêàòîðà";
extern int timeframe      = 1440;
extern int period         = 14;
extern int applied_price  = 0;

 int Ðàçìåð_øðèôòà  = 10;
 int óãîë           = 0;//0-3
//+------------------------------------------------------------------+
//| Custom indicator initialization function                         |
//+------------------------------------------------------------------+
int init()
  {
//---- indicators
   ObjectCreate("TF",OBJ_LABEL,0,0,0,0,0);
   ObjectCreate("RSI",OBJ_LABEL,0,0,0,0,0);
   ObjectCreate("Arow",OBJ_LABEL,0,0,0,0,0);
//----
   return(0);
  }
//+------------------------------------------------------------------+
//| Custom indicator deinitialization function                       |
//+------------------------------------------------------------------+
int deinit()
  {
//----
   ObjectDelete ("TF");
   ObjectDelete ("RSI");
   ObjectDelete ("Arow");
//----
   return(0);
  }
//+------------------------------------------------------------------+
//| Custom indicator iteration function                              |
//+------------------------------------------------------------------+
int start()
  {
//----
   int limit;
   int counted_bars=IndicatorCounted();

   if(counted_bars<0) return(-1);

   if(counted_bars>0) counted_bars--;
   limit=Bars-counted_bars;

   double RSI_0,RSI_1,delta_RSI;
   color colir_1,colir_2;
   string Arow;

   for(int i=limit; i>=0; i--)
   {
    RSI_0 = iRSI(Symbol(),timeframe,period,applied_price,i);
    RSI_1 = iRSI(Symbol(),timeframe,period,applied_price,i+1);
    delta_RSI = RSI_0 - RSI_1;
    if(RSI_0>=50)colir_1 = Green;
    else colir_1 = Red;
    if(delta_RSI>0){colir_2 = Green;Arow = "ñ";}
    else {colir_2 = Red;Arow = "ò";}
   }
//----
     string TF ="TF = "+GetNameTF(timeframe)+" ("+timeframe+")";
     string RSI ="RSI = "+DoubleToStr(RSI_0,2);

     ObjectSetText("TF",TF,Ðàçìåð_øðèôòà,"Arial Black",Lime);
     ObjectSet("TF",OBJPROP_XDISTANCE,3);
     ObjectSet("TF",OBJPROP_YDISTANCE,30);
     ObjectSet("TF",OBJPROP_CORNER,óãîë);

     ObjectSetText("RSI",RSI,Ðàçìåð_øðèôòà,"Arial Black",Lime);
     ObjectSet("RSI",OBJPROP_XDISTANCE,3);
     ObjectSet("RSI",OBJPROP_YDISTANCE,50);
     ObjectSet("RSI",OBJPROP_COLOR,colir_1);
     ObjectSet("RSI",OBJPROP_CORNER,óãîë);

     ObjectSetText("Arow",Arow,Ðàçìåð_øðèôòà+2,"Wingdings",Lime);
     ObjectSet("Arow",OBJPROP_XDISTANCE,90);
     ObjectSet("Arow",OBJPROP_YDISTANCE,50);
     ObjectSet("Arow",OBJPROP_COLOR,colir_2);
     ObjectSet("Arow",OBJPROP_CORNER,óãîë);
//----
   return(0);
  }
//+------------------------------------------------------------------+
//|  Îïèñàíèå : Âîçâðàùàåò íàèìåíîâàíèå òàéìôðåéìà                             |
//+----------------------------------------------------------------------------+
//|  Ïàðàìåòðû:                                                                |
//|    TimeFrame - òàéìôðåéì (êîëè÷åñòâî ñåêóíä)      (0 - òåêóùèé ÒÔ)         |
//+----------------------------------------------------------------------------+
string GetNameTF(int TimeFrame=0) {
  if (TimeFrame==0) TimeFrame=Period();
  switch (TimeFrame) {
    case PERIOD_M1:  return("M1");
    case PERIOD_M5:  return("M5");
    case PERIOD_M15: return("M15");
    case PERIOD_M30: return("M30");
    case PERIOD_H1:  return("H1");
    case PERIOD_H4:  return("H4");
    case PERIOD_D1:  return("Daily");
    case PERIOD_W1:  return("Weekly");
    case PERIOD_MN1: return("Monthly");
    default:         return("UnknownPeriod");
  }
}
Comments