YaannaSignal
Download script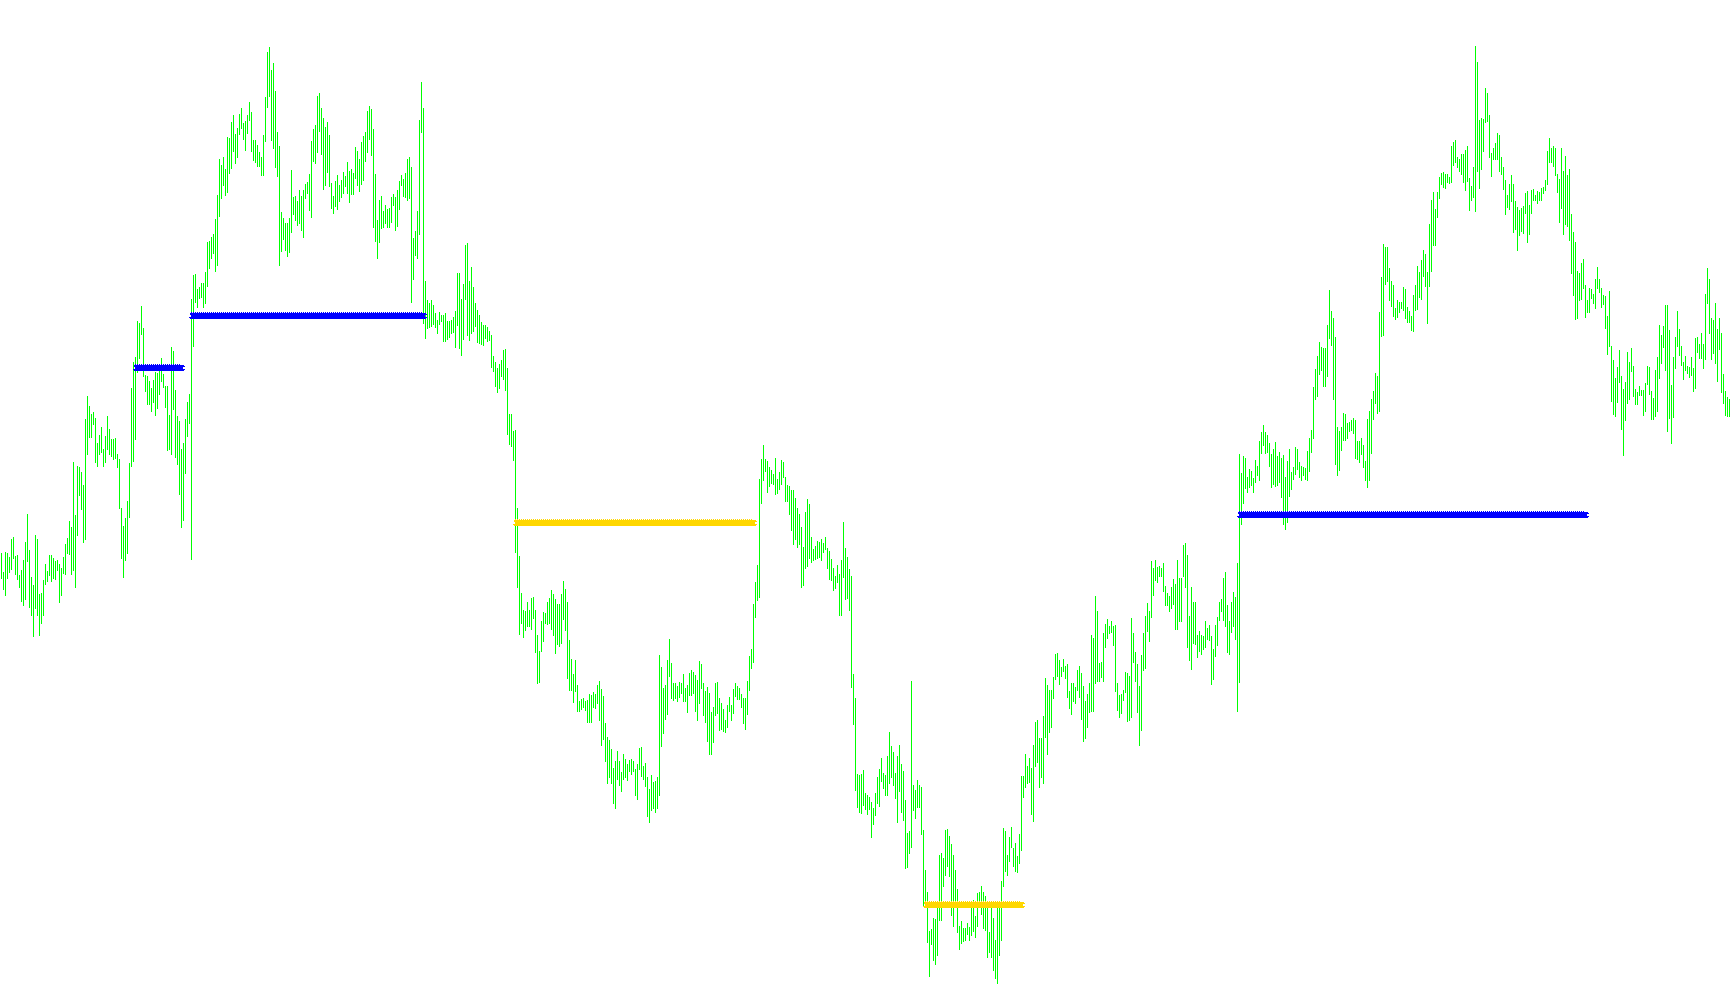
This tool is designed as a visual trading indicator that identifies potential entry points by analyzing price positioning relative to volatility bands and historical trends. Instead of just looking at the current price, it calculates where the market is currently "sitting" within a specific range to determine if it is overextended or primed for a reversal.
Core Logic Overview
The script operates by measuring the distance between the high and low limits of a Bollinger Band (a standard technical analysis tool) over a defined period. It then determines the relative position of the current price within that space, expressed as a percentage.
How it Identifies Signals
The indicator focuses on two primary actions: identifying opportunities to sell and opportunities to buy.
- Sell Opportunities: The logic monitors the price's position within the volatility range. If the price moves significantly toward the upper extreme (exceeding a specific threshold), the system flags a potential selling opportunity. This suggests that the asset may be overextended in an upward direction and could be due for a correction.
- Buy Opportunities: Conversely, if the price drops toward the lower extreme of the volatility range, the script identifies a potential buying zone. It looks for instances where the price is "low" enough to suggest that a corrective move back upward is likely.
Visual Feedback and Alerts
To help the user navigate these signals without cluttering the chart, the script uses the following methods:
- On-Chart Markers: When a specific condition is met, the indicator places visual markers (arrows) on the chart to highlight the entry point.
- Dynamic Status Comments: The tool provides real-time text feedback in the corner of the screen. It communicates whether the system is currently identifying an opportunity to sell or buy and informs the user if it is waiting for a price correction to confirm the move.
Key Parameters
The behavior of the script is governed by three main settings:
- Band Period: Determines how far back in time the indicator looks to calculate volatility and averages.
- Buy/Sell Stops: These act as "sensitivity" levels. They define exactly how deep into the upper or lower zones the price must travel before the script registers a signal, allowing users to filter out minor fluctuations and focus on significant movements.
//+------------------------------------------------------------------+
//|                                                 YaannaSignal.mq4 |
//|                             Copyright © 2009, Victor Chebotariov |
//+----[ ICQ ]-------------------------------------------------------+
//|   342-574-15                                                     |
//+----[ Phone ]-----------------------------------------------------+
//|   +380958965042                                                  |
//|   +380652707069                                                  |
//|   +380443609960                                                  |
//+----[ Web ]-------------------------------------------------------+
//|   http://chebotariov.com                                         |
//|   http://chebotariov.co.ua                                       |
//|   http://amero.com.ua                                            |
//|   http://amero.co.ua                                             |
//|   http://investmoney.kiev.ua                                     |
//|   http://riskinvest.kiev.ua                                      |
//|   http://tetrabourse.com.ua                                      |
//|   http://tb-unitrade.com.ua                                      |
//|   http://i-contact.kiev.ua                                       |
//|   http://srubidom.com                                            |
//+----[ E-mail ]----------------------------------------------------+
//|   victor@chebotariov.co.ua                                       |
//+------------------------------------------------------------------+
#property copyright "Copyright © 2009, Victor Chebotariov"
#property link      "http://www.chebotariov.com"

#property indicator_chart_window
#property indicator_buffers 2
#property indicator_color1 Blue
#property indicator_color2 Red
//---- input parameters
extern int BBPeriod=200;
extern int BuyStop=40;
extern int SellStop=60;
//---- buffers
double ExtMapBuffer1[];
double ExtMapBuffer2[];
//+------------------------------------------------------------------+
//| Custom indicator initialization function                         |
//+------------------------------------------------------------------+
int init()
  {
//---- indicators
   SetIndexStyle(0,DRAW_ARROW);
   SetIndexBuffer(0,ExtMapBuffer1);
   SetIndexStyle(1,DRAW_ARROW);
   SetIndexBuffer(1,ExtMapBuffer2);
//----
   return(0);
  }
//+------------------------------------------------------------------+
//| YaannaSignal                                                     |
//+------------------------------------------------------------------+
int start()
  {
   int i,counted_bars=IndicatorCounted();
//----
   i=Bars-counted_bars-1;
   while(i>=0)
     {
      string name = BBPeriod+"_"+BuyStop+"_"+SellStop+"_"+Symbol()+Period();
      double highbb = iBands(NULL,0,BBPeriod,2,0,PRICE_LOW,MODE_UPPER,i);
      double lowbb = iBands(NULL,0,BBPeriod,2,0,PRICE_LOW,MODE_LOWER,i);
      double close = Close[i];
      double ma = iMA(NULL,0,BBPeriod,0,0,0,i);
      double visota = (highbb-lowbb); // âûñîòà == 100%
      if(visota==0){visota=1;}
      double pclose = (close-lowbb); // öåíà
      double enter = pclose/visota*100;

      double vLow=Low[iLowest(NULL,0,MODE_LOW,10,i+3)];
      double vHigh=High[iHighest(NULL,0,MODE_HIGH,10,i+3)];

      double buy = GlobalVariableGet(name+"_buy");
      double sell = GlobalVariableGet(name+"_sell");


      if(enter<0 && buy==0){GlobalVariableSet(name+"_buy",Close[i]);}
      if(enter>=BuyStop){GlobalVariableSet(name+"_buy",0);}
      if(enter>100 && sell==0){GlobalVariableSet(name+"_sell",Close[i]);}
      if(enter<=SellStop){GlobalVariableSet(name+"_sell",0);}

      if(buy!=0)
         {
            ExtMapBuffer1[i]=buy;
            Comment("Ïîçäíî ïðîäàâàòü, äîæäèòåñü êîððåêöèè");
         }
      else if(sell!=0)
         {
            ExtMapBuffer2[i]=sell;
            Comment("Ïîçäíî ïîêóïàòü, äîæäèòåñü êîððåêöèè");
         }
      else
         {
            Comment("---");
         }
      i--;
     }
//----
   return(0);
  }
//+------------------------------------------------------------------+
Comments