ZeroLag MACD
Download script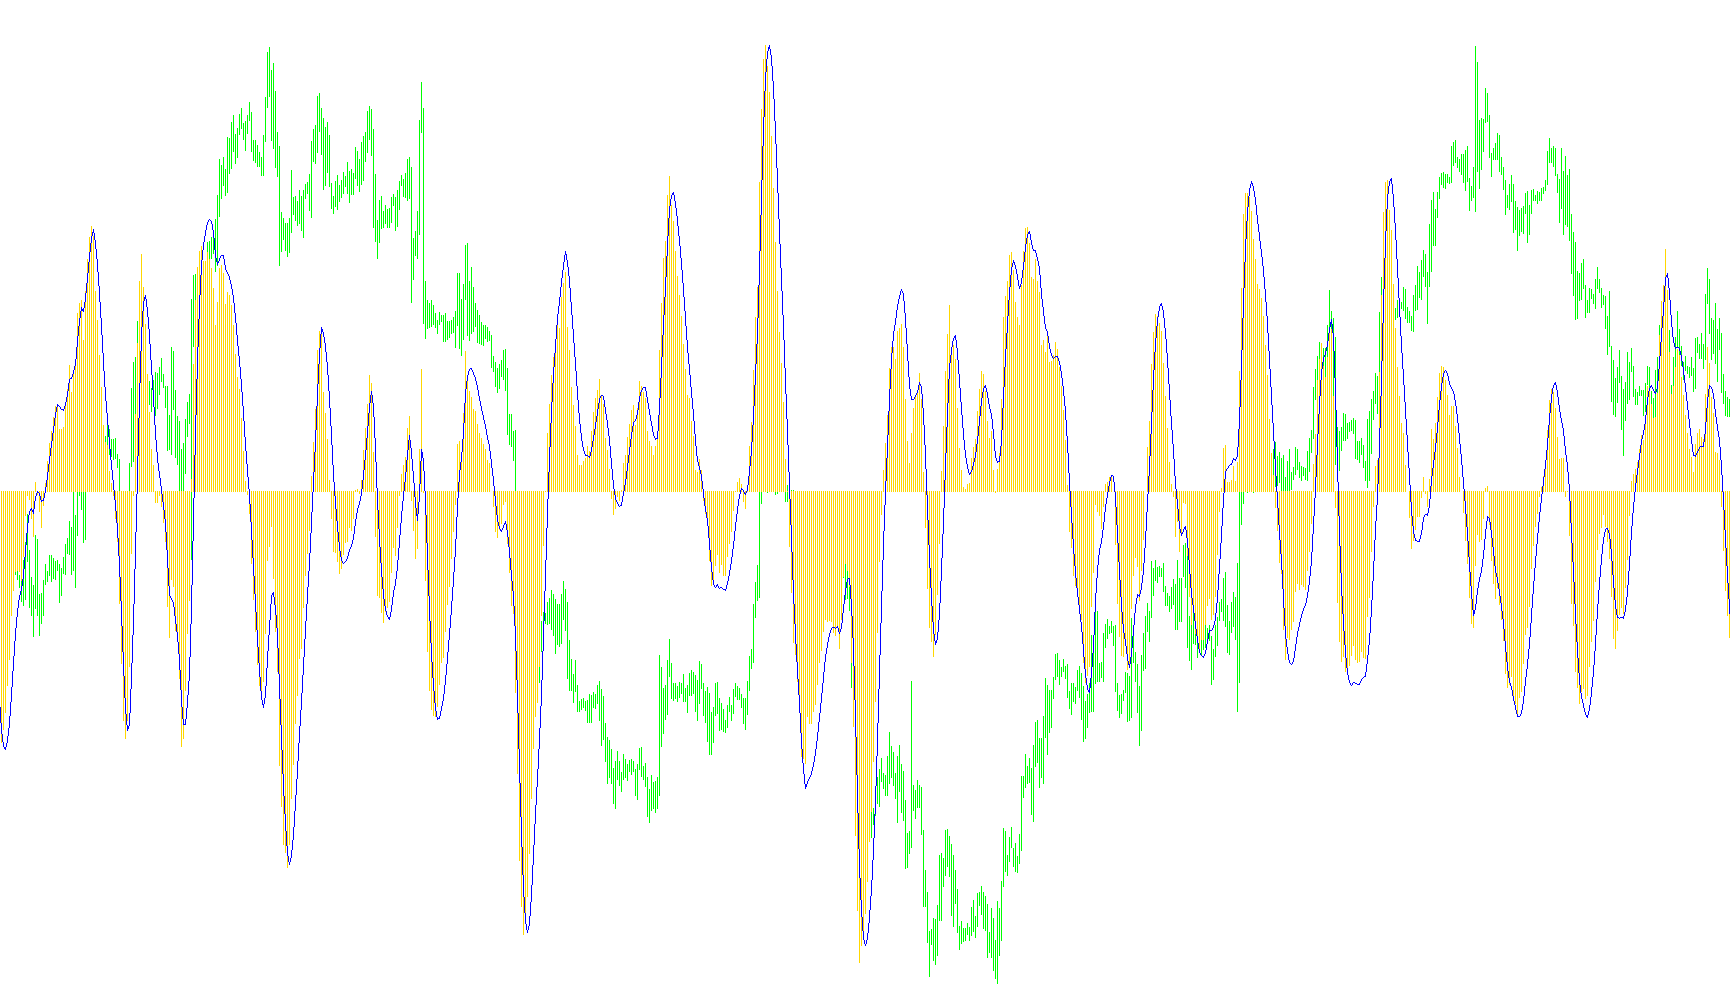
The ZeroLag MACD is a technical analysis tool designed for the MetaTrader platform to help traders identify momentum and trend shifts in the financial markets. It improves upon the standard Moving Average Convergence Divergence (MACD) indicator by incorporating a "ZeroLag" calculation, which aims to reduce the natural delay that occurs when using traditional moving averages.
How it Works
The logic of this script follows a multi-layered processing sequence to refine price data into actionable visual signals:
1. Foundation: Establishing Trend Baselines The indicator starts by calculating two primary Exponential Moving Averages (EMAs)—a "Fast" and a "Slow" version. These represent the short-term and long-term price trends, respectively. By looking at these averages, the tool begins to understand the general direction of the market.
2. The ZeroLag Adjustment Standard indicators often lag behind current price action because they average past data. To counter this, the script applies a unique mathematical correction to both the Fast and Slow EMAs. It calculates an additional average of the averages and subtracts it from the original values. This process "flattens" the delay, allowing the indicator to react more quickly to sudden changes in price momentum while maintaining a smooth visual flow.
3. Calculating the MACD Line Once the adjusted (ZeroLag) versions of the Fast and Slow trends are established, the script subtracts the slowed trend from the accelerated trend. The result is the MACD Line, which appears as a histogram on your chart. This represents the immediate strength and direction of the current price movement.
4. The Signal Refinement To help traders filter out "market noise" (minor fluctuations that aren't true trend changes), the script performs one final calculation. It takes the MACD data produced in the previous step and applies another layer of ZeroLag processing to create a Signal Line.
Visual Output and Interpretation
On your trading platform, this logic produces two distinct visual elements:
- The Histogram (MACD): Shows the primary momentum of the market. When it moves higher or lower, it indicates increasing strength in that direction.
- The Signal Line: Acts as a secondary guide. Traders typically look for "crossovers" between the histogram and this line to identify potential entry or exit points, providing a clearer picture of when a trend is beginning to lose steam or gaining new power.
By combining these elements, the ZeroLag MACD provides a more responsive and "current" view of market dynamics compared to standard moving average tools.
//+------------------------------------------------------------------+
//|                                                 ZeroLag MACD.mq4 |
//|                                                               RD |
//|                                                 marynarz15@wp.pl |
//+------------------------------------------------------------------+
#property copyright "RD"
#property link      "marynarz15@wp.pl"
//----
#property indicator_separate_window
#property  indicator_buffers 2
#property indicator_color1 Blue
#property indicator_color2 Red
//---- input parameters
extern int FastEMA = 12;
extern int SlowEMA = 24;
extern int SignalEMA = 9;
//---- buffers
double MACDBuffer[];
double SignalBuffer[];
double FastEMABuffer[];
double SlowEMABuffer[];
double SignalEMABuffer[];
//+------------------------------------------------------------------+
//| Custom indicator initialization function                         |
//+------------------------------------------------------------------+
int init()
  {
//---- indicators
   IndicatorBuffers(5);
   SetIndexBuffer(0, MACDBuffer);
   SetIndexBuffer(1, SignalBuffer);
   SetIndexBuffer(2, FastEMABuffer);
   SetIndexBuffer(3, SlowEMABuffer);
   SetIndexBuffer(4, SignalEMABuffer);
   SetIndexStyle(0, DRAW_HISTOGRAM);
   SetIndexStyle(1, DRAW_LINE,EMPTY);
   SetIndexDrawBegin(0, SlowEMA);
   SetIndexDrawBegin(1, SlowEMA);
   IndicatorShortName("ZeroLag MACD(" + FastEMA + "," + SlowEMA + "," + SignalEMA + ")");
   SetIndexLabel(0, "MACD");
   SetIndexLabel(1, "Signal");
//----
   return(0);
  }
//+------------------------------------------------------------------+
//| Custor indicator deinitialization function                       |
//+------------------------------------------------------------------+
int deinit()
  {
//----
   return(0);
  }
//+------------------------------------------------------------------+
//| Custom indicator iteration function                              |
//+------------------------------------------------------------------+
int start()
  {
   int limit;
   int counted_bars = IndicatorCounted();
   if(counted_bars < 0)
       return(-1);
   if(counted_bars > 0)
       counted_bars--;
   limit = Bars - counted_bars;
   double EMA, ZeroLagEMAp, ZeroLagEMAq;
   for(int i = 0; i < limit; i++)
     {
       FastEMABuffer[i] = iMA(NULL, 0, FastEMA, 0, MODE_EMA, PRICE_CLOSE, i);
       SlowEMABuffer[i] = iMA(NULL, 0, SlowEMA, 0, MODE_EMA, PRICE_CLOSE, i);
     }
   for(i = 0; i < limit; i++)
     {
        EMA = iMAOnArray(FastEMABuffer, Bars, FastEMA, 0, MODE_EMA, i);
        ZeroLagEMAp = FastEMABuffer[i] + FastEMABuffer[i] - EMA;
        EMA = iMAOnArray(SlowEMABuffer, Bars, SlowEMA, 0, MODE_EMA, i);
        ZeroLagEMAq = SlowEMABuffer[i] + SlowEMABuffer[i] - EMA;
        MACDBuffer[i] = ZeroLagEMAp - ZeroLagEMAq;
     }
   for(i = 0; i < limit; i++)
       SignalEMABuffer[i] = iMAOnArray(MACDBuffer, Bars, SignalEMA, 0, MODE_EMA, i);
   for(i = 0; i < limit; i++)
     {
       EMA = iMAOnArray(SignalEMABuffer, Bars, SignalEMA, 0, MODE_EMA, i);
       SignalBuffer[i] = SignalEMABuffer[i] + SignalEMABuffer[i] - EMA;
     }
   return(0);
  }
//+------------------------------------------------------------------+
Comments