TSD_PP_MACD_FORCE_Ind_v1_v1
Download script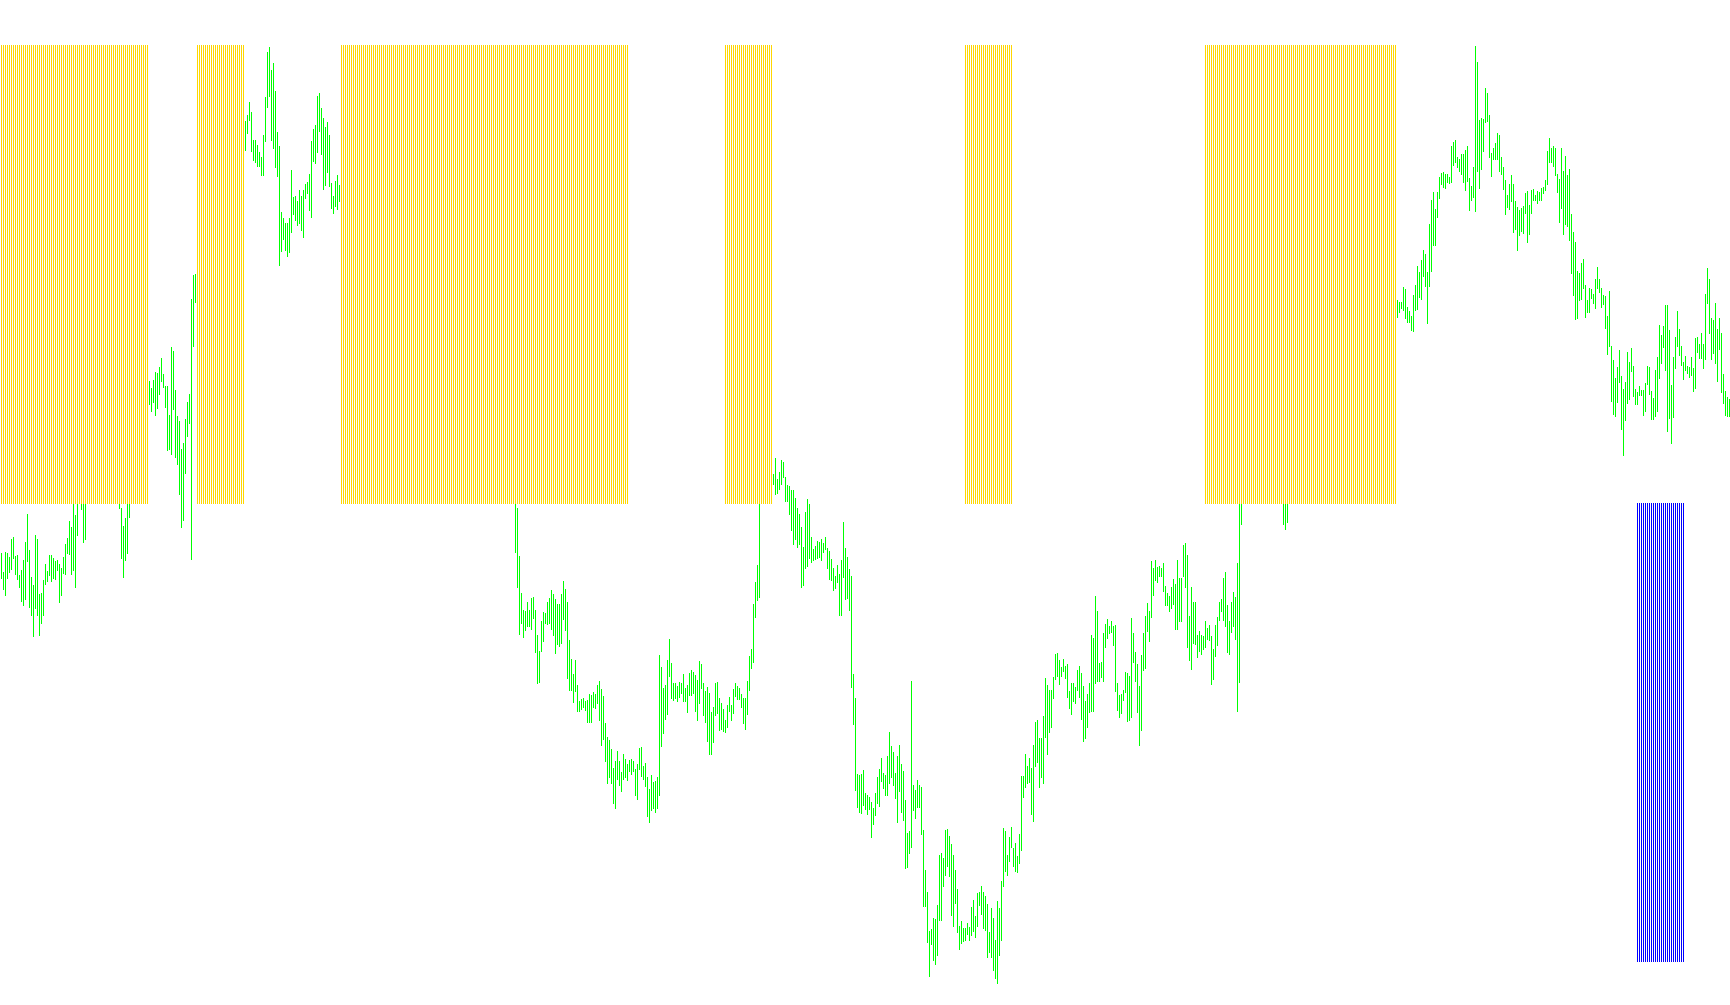
This technical tool is designed to help traders identify high-probability market turns by analyzing the relationship between long-term momentum and short-term price action. It works by synthesizing data from two different timeframes simultaneously: the Weekly chart and the Daily chart.
Core Logic Overview
The indicator functions by comparing "momentum" against "force." Instead of looking at just one set of numbers, it looks for specific contradictions between what is happening on a large scale (weeks) and what is happening on a smaller scale (days).
Key Components of the Analysis:
1. Long-Term Momentum (Weekly Context) The script first examines the Weekly timeframe using a Moving Average Convergence Divergence (MACD) calculation. It looks at the trend over recent weeks to determine the broader market direction:
- If the momentum is moving upward, it marks a positive direction.
- If the momentum is moving downward, it marks a negative direction.
2. Short-Term Force (Daily Context) Simultaneously, the script analyzes the Daily timeframe using a "Force" indicator (specifically an Exponential Moving Average). This measures the immediate strength or pressure of the price at a specific point in time.
3. The Interaction (Signal Generation) The final output—the visual signals on your chart—is generated only when these two different perspectives conflict in a specific way:
- Bullish Signal: The script looks for a situation where the long-term weekly momentum is moving up, but the short-term daily force shows a negative reading. When these two conditions meet, it triggers a visual signal (represented as a "Green" histogram).
- Bearish Signal: Conversely, it looks for a situation where the long-term weekly momentum is moving down, while the short-term daily force shows a positive reading. When this happens, it triggers a visual signal (represented as a "Red" histogram).
Summary for the Trader
Essentially, this tool acts as a "contradiction detector." It highlights moments where the immediate daily price action is pulling against the broader weekly trend. By visualizing these specific points of friction, it aims to provide traders with clear cues on where the market might be experiencing significant pressure or potential exhaustion.
/*-----------------------------+
|			       |
| Shared by www.Aptrafx.com    |
|			       |
+------------------------------*/

//+------------------------------------------------------------------+
//|                                     TSD_PP_MACD_FORCE_Ind_v1.mq4 |
//|                                    (From Elders Book) |
//|                           Copyright ® 2005 Bob O'Brien / Barcode |
//|             TSD Indicator by Pedro Puado                         |
//|                                        TSD Indicator version 1   |
//+------------------------------------------------------------------+
#property copyright "Pedro Puado (From Elders Book)"
#property link      "http://www.metaquotes.net"

#property indicator_separate_window
#property indicator_buffers 2
#property indicator_color1 Green
#property indicator_color2 Red
//---- input parameters
extern int       Force=2;
extern int       FastMA=12;
extern int       SlowMA=26;
extern int       Signal=9;
extern int       MaxBars=1000;
//---- buffers
double ExtMapBuffer1[];
double ExtMapBuffer2[];
//+------------------------------------------------------------------+
//| Custom indicator initialization function                         |
//+------------------------------------------------------------------+
int init()
  {
//---- indicators
   SetIndexStyle(0,DRAW_HISTOGRAM);
   SetIndexBuffer(0,ExtMapBuffer1);
   SetIndexLabel(0,"Up");
   SetIndexStyle(1,DRAW_HISTOGRAM);
   SetIndexBuffer(1,ExtMapBuffer2);
   SetIndexLabel(1,"Down");
//----
   return(0);
  }
//+------------------------------------------------------------------+
//| Custor indicator deinitialization function                       |
//+------------------------------------------------------------------+
int deinit()
  {
//----

//----
   return(0);
  }
//+------------------------------------------------------------------+
//| Custom indicator iteration function                              |
//+------------------------------------------------------------------+
int start()
  {
   int    counted_bars=IndicatorCounted();
   double MacdPrevious, MacdPrevious2, force, ForcePos, ForceNeg;
   int    Direction;
//----
   int    i,k, nDay, nWeek;
   i=Bars-1;
   if(counted_bars>0) i=Bars-counted_bars+0;
   i = MathMin(i, MaxBars);

   while (i >=0)
   {
      nWeek = GetWeekIndex(i);
      MacdPrevious  = iMACD(Symbol(),PERIOD_W1,SlowMA,FastMA,Signal,PRICE_CLOSE,MODE_MAIN,nWeek+1);
      MacdPrevious2 = iMACD(Symbol(),PERIOD_W1,SlowMA,FastMA,Signal,PRICE_CLOSE,MODE_MAIN,nWeek+2);

      if (MacdPrevious > MacdPrevious2) Direction = 1;
      if (MacdPrevious < MacdPrevious2) Direction = -1;
      if (MacdPrevious == MacdPrevious2) Direction = 0;

      nDay = GetDayIndex(i);
      force = iForce(Symbol(),PERIOD_D1,Force,MODE_EMA,PRICE_CLOSE,nDay+1);
      ForcePos = force > 0;
      ForceNeg = force < 0;
      Print(nWeek, " - ", Direction, " - ", nDay, " - ", Force);

	   if(Direction == 1 && ForceNeg)
	   {
	      ExtMapBuffer1[i] = 1;
	      ExtMapBuffer2[i] = 0.0;
	   }

	   if(Direction == -1 && ForcePos)
	   {
	      ExtMapBuffer1[i] = 0.0;
	      ExtMapBuffer2[i] = -1;
	   }

      i--;
   }
//----
   return(0);
  }
//+------------------------------------------------------------------+
//+------------------------------------------------------------------+

int GetWeekIndex(int x)
{
      datetime dSun = StrToTime(TimeToStr(Time[x]-(TimeDayOfWeek(Time[x])*86400),TIME_DATE));
      return (((iTime(Symbol(),PERIOD_W1,0)-dSun)/86400)/7);
}
//+------------------------------------------------------------------+

int GetDayIndex(int x)
{
      if (Period() == PERIOD_D1) return (x);

      int nWeek = GetWeekIndex(x)*5; //number of days since
      datetime dSun = StrToTime(TimeToStr(Time[x],TIME_DATE));
      int i = MathAbs((iTime(Symbol(),PERIOD_D1,nWeek)-dSun)/86400);
      return (nWeek-i);
}
//+------------------------------------------------------------------+
Comments