TSD_CyAn_4_Cyber Cycle
Download script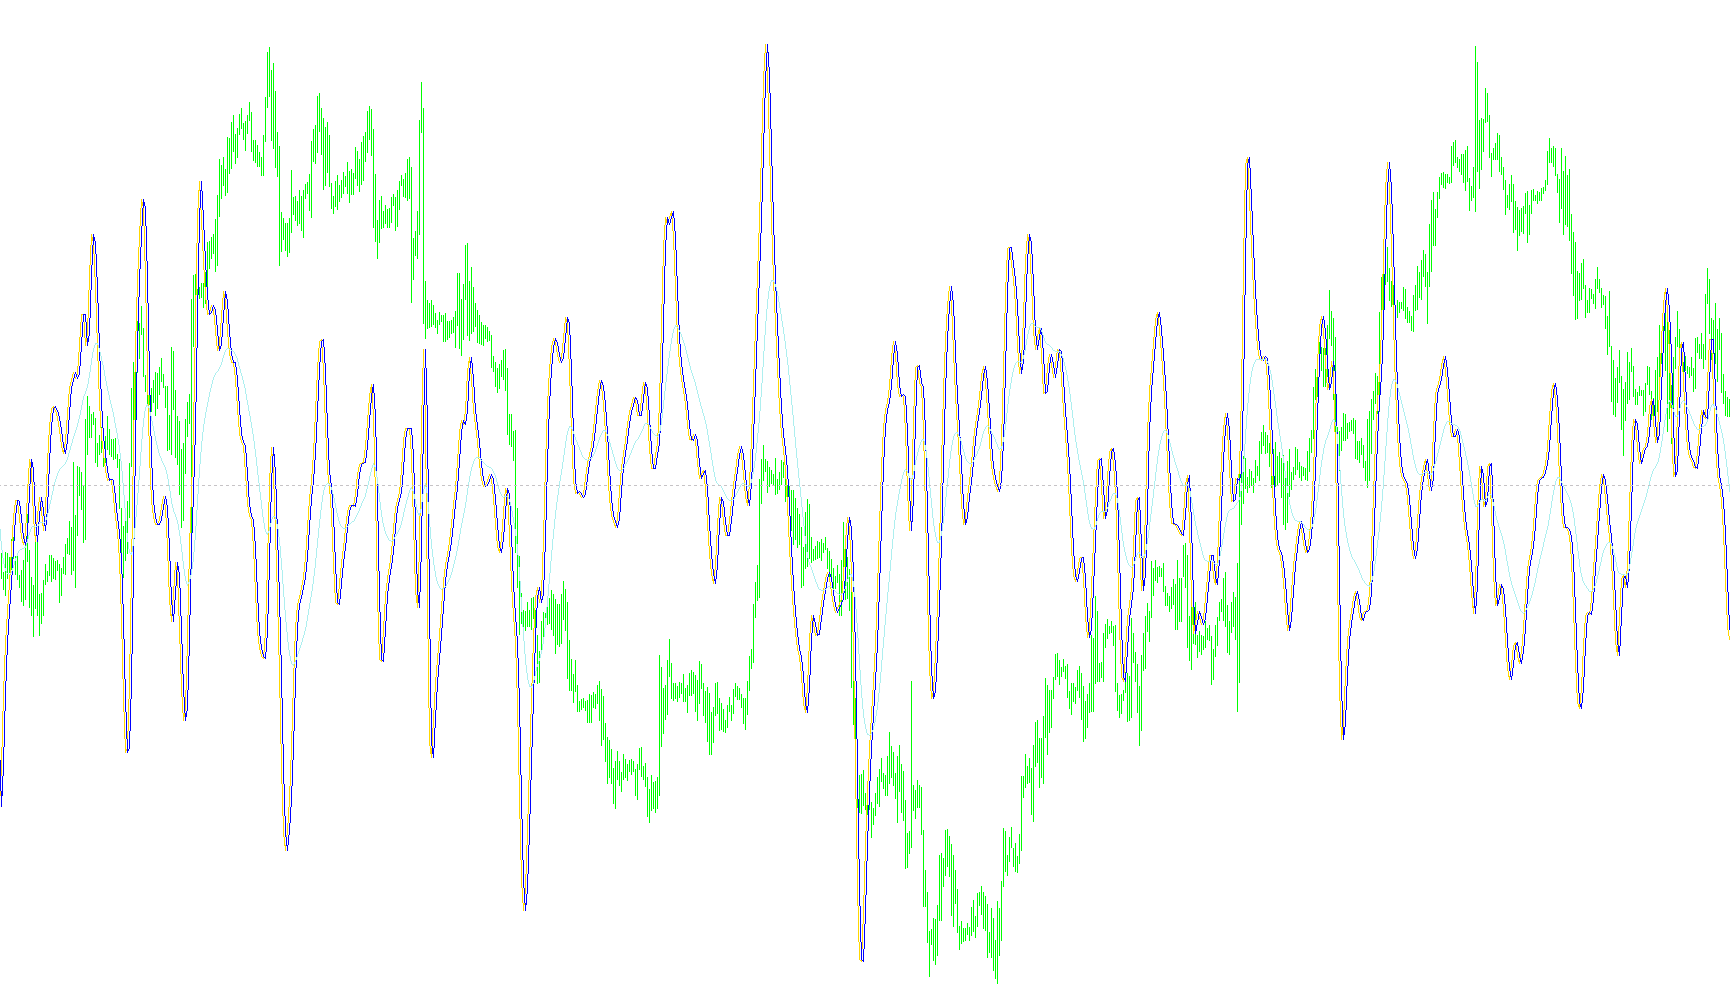
The Cyber Cycle is a technical analysis tool designed to provide traders with a visual representation of market momentum and price trends. Unlike standard indicators that may react too quickly or too slowly to price movements, this script uses specialized smoothing logic to identify underlying cycles in the data.
Core Functionality
The primary objective of this script is to filter out "market noise"—the small, erratic fluctuations in price—to reveal the smoother flow of the market. It does this by processing price data through three distinct layers of calculation:
1. Price Selection and Weighting
The indicator begins by deciding which price points to observe. Depending on your settings, it can look at:
- Median Prices: The midpoint between the high and low of a period.
- Typical Prices: An average of the high, low, and closing prices.
Once selected, the script looks back at a window of four consecutive price points. It applies a weighted distribution to these points, giving more significance to the middle values (the immediate past) than to the outermost values. This helps the indicator remain anchored to the most relevant recent data while still acknowledging the preceding trend.
2. The Smoothing Engine
After calculating the weighted average, the script feeds that data into a sophisticated smoothing formula. This is the "heart" of the Cyber Cycle. It uses a mathematical constant (Alpha) to determine how much weight to give to new information versus historical data. By blending the current weighted average with previous calculations, it produces a fluid, continuous line that avoids the jagged edges typical of raw price charts.
3. Signal Generation and Lag Reduction
The script ultimately outputs three different lines/buffers:
- Primary Cycle: The main smoothed trend line.
- Shifted Trend: A direct look-back of the primary cycle, used to observe the immediate "echo" of the trend.
- Signal Line: A final calculation that applies an additional smoothing layer to the primary cycle. This is designed to create a "signal" that reacts more deliberately to turns in the market, helping traders differentiate between a minor pause and a genuine change in direction.
Summary for the User
In simple terms, this tool takes raw, messy price action and "distills" it. By weighting recent history and applying multiple layers of smoothing, it provides a visual map of the current cycle. It allows you to see where the market is heading by stripping away the distractions of minute-to-minute volatility.
//+------------------------------------------------------------------+
//|                                               Cyber Cycle        |
//|                         Copyright © 2006, Luis Guilherme Damiani |
//|                                      http://www.damianifx.com.br |
//|
//+------------------------------------------------------------------+
#property copyright "Copyright © 2006, Luis Guilherme Damiani"
#property link      "http://www.damianifx.com.br"

#property indicator_buffers 3
#property indicator_separate_window
//#property indicator_chart_window

#property indicator_color1 Red
#property indicator_color2 LightBlue
#property indicator_color3 Yellow

//---- input parameters
extern double       alpha=0.07;
//extern int       maxbars=2000;
extern double lag_signal2=9;
//extern bool stochfish=true;
//extern int stochfish_window=8;
extern string
Price_Choice="-----  Typical or Median  --------------";
extern bool is_median=true;

//---- buffers
double ind1[];
double ind2[];
double ind3[];
double AuxBuffer[]; //Smooth

double alpha2;
//+------------------------------------------------------------------+
//| Custom indicator initialization function                         |
//+------------------------------------------------------------------+
int init()
  {
//---- indicators
   SetIndexStyle(0,DRAW_LINE);
   SetIndexBuffer(0,ind1);
   SetIndexStyle(1,DRAW_LINE);
   SetIndexBuffer(1,ind2);
   SetIndexStyle(2,DRAW_LINE);
   SetIndexBuffer(2,ind3);
   SetLevelValue(0,0.0);
//   SetLevelValue(1,-0.8);
//   ArrayInitialize(ind1,0.0);
//   ArrayInitialize(ind2,0.0);
//   ArrayInitialize(ind3,0.0);
   ArrayResize(AuxBuffer,Bars);
//   ArrayInitialize(AuxBuffer,0.0);
   alpha2=1/(lag_signal2+1);

//----
   return(0);
  }
//+------------------------------------------------------------------+
//| Custor indicator deinitialization function                       |
//+------------------------------------------------------------------+
int deinit()
  {
//----

//----
   return(0);
  }
//+------------------------------------------------------------------+
//| Custom indicator iteration function                              |
//+------------------------------------------------------------------+

int start()
  {
      double pr0,pr1,pr2,pr3=0;

      int    counted_bars=IndicatorCounted();

      //---- check for possible errors
      if(counted_bars<0) return(-1);
      int limit=Bars-counted_bars;
  //    if(limit>maxbars)limit=maxbars;
      //if (limit>Bars-1)limit=Bars-1;
      //----
      for (int i = limit; i>=0;i--)
      {
         if(is_median)
         {
            pr0=(High[i]+Low[i])/2;
            pr1=(High[i+1]+Low[i+1])/2;
            pr2=(High[i+2]+Low[i+2])/2;
            pr3=(High[i+3]+Low[i+3])/2;
         }
         else
         {
            pr0=(High[i]+Low[i]+Close[i])/3;
            pr1=(High[i+1]+Low[i+1]+Close[i+1])/3;
            pr2=(High[i+2]+Low[i+2]+Close[i+2])/3;
            pr3=(High[i+3]+Low[i+3]+Close[i+3])/3;
         }

	      AuxBuffer[i]= (pr0+2*pr1+2*pr2+pr3)/6;

	      ind1[i]=MathPow(1-0.5*alpha,2)*(AuxBuffer[i]-2*AuxBuffer[i+1]+AuxBuffer[i+2])
	              +2*(1-alpha)*ind1[i+1]
	              -MathPow(1-alpha,2)*ind1[i+2];

	      ind2[i]=ind1[i+1];
	      ind3[i]=alpha2*ind1[i]+(1-alpha2)*ind3[i+1];

       }

//----
   return(0);
  }
//+------------------------------------------------------------------+
Comments