TSD_CyAn_5_CG Oscillator
Download script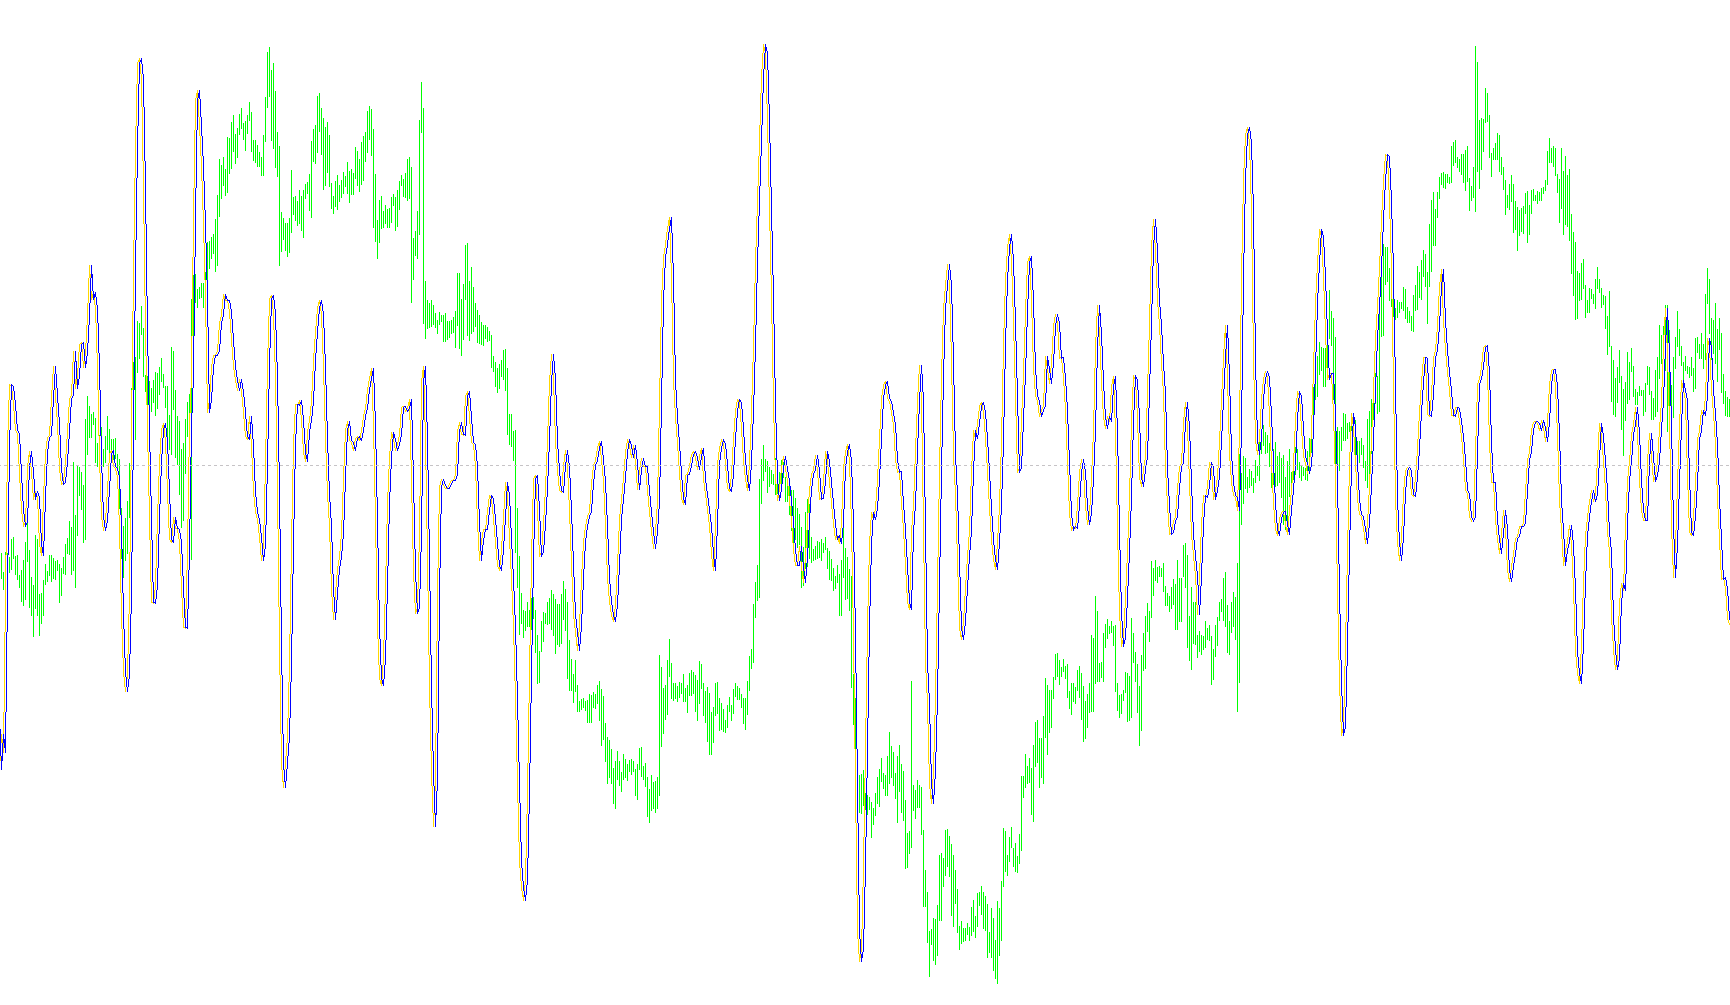
This tool is designed as a momentum-based visual aid for traders, specifically created to help identify price trends and fluctuations by analyzing the relationship between historical data points. Instead of cluttering the main price chart, it operates in a separate window, providing a cleaner look at market dynamics.
Core Logic and Functionality
The script calculates a unique moving average that places a heavier emphasis on more recent price actions. Here is a breakdown of how it processes information:
1. Price Selection Strategy The tool allows you to choose between two different ways of interpreting "price" at each moment:
- Median: It looks at the midpoint between the highest and lowest prices reached during a specific period.
- Typical: It takes an average of three data points: the high, the low, and the actual closing price of that period.
2. Weighted Momentum Calculation Unlike a standard moving average where every day or hour carries equal weight, this script uses a weighted approach. It looks back over a specific number of candles (defined by the user) and multiplies each point by its position in time. This means that more recent data has a significantly higher impact on the final result than older data. By doing this, the indicator reacts more fluidly to current market shifts while still maintaining the context of previous movement.
3. Visual Output The script produces two distinct lines on your screen:
- The Primary Line: This represents the actual weighted calculation. It is normalized so that it oscillates around a central zero point, making it easier to see if the momentum is trending upward or downward relative to the average.
- The Secondary Line: This serves as a "shadow" or delayed version of the primary line (tracking the previous value). By comparing these two lines, traders can visually identify shifts in speed, direction, and potential trend reversals more clearly.
Summary for the Trader
Essentially, this script smooths out the "noise" of the market to reveal the underlying trend. Because it prioritizes recent price action through its weighted logic, it aims to provide a more responsive view of where the market is heading right now, helping you stay ahead of sudden changes in momentum.
//+------------------------------------------------------------------+
//|                                            CG Oscillator         |
//|                         Copyright © 2006, Luis Guilherme Damiani |
//|                                      http://www.damianifx.com.br |
//|
//+------------------------------------------------------------------+
#property copyright "Copyright © 2006, Luis Guilherme Damiani"
#property link      "http://www.damianifx.com.br"

#property indicator_buffers 2
#property indicator_separate_window
//#property indicator_chart_window

#property indicator_color1 Yellow
#property indicator_color2 Blue
//#property indicator_color3 Yellow

//---- input parameters
extern double length=8;
//extern int    maxbars=2000;

extern string
Price_Choice="-----  Typical or Median  --------------";
extern bool is_median=true;

//---- buffers
double ind1[];
double ind2[];
//double ind3[];
//double AuxBuffer[]; //Smooth

//+------------------------------------------------------------------+
//| Custom indicator initialization function                         |
//+------------------------------------------------------------------+
int init()
  {
//---- indicators
   SetIndexStyle(0,DRAW_LINE);
   SetIndexBuffer(0,ind1);
   SetIndexStyle(1,DRAW_LINE);
   SetIndexBuffer(1,ind2);
  // SetIndexStyle(2,DRAW_LINE);
  // SetIndexBuffer(2,ind3);
   SetLevelValue(0,0.0);
//   SetLevelValue(1,-0.8);
//   ArrayInitialize(ind1,0.0);
//   ArrayInitialize(ind2,0.0);
//   ArrayInitialize(ind3,0.0);
///   ArrayResize(AuxBuffer,maxbars+3);
 //  ArrayInitialize(AuxBuffer,0.0);


//----
   return(0);
  }
//+------------------------------------------------------------------+
//| Custor indicator deinitialization function                       |
//+------------------------------------------------------------------+
int deinit()
  {
//----

//----
   return(0);
  }
//+------------------------------------------------------------------+
//| Custom indicator iteration function                              |
//+------------------------------------------------------------------+

int start()
  {

      int    counted_bars=IndicatorCounted();
      double num=0,denom=0;
      //---- check for possible errors
      if(counted_bars<0) return(-1);
      int limit=Bars-counted_bars;
      //if(limit>maxbars)limit=maxbars;
      //if (limit>Bars-1)limit=Bars-1;
      //----
      for (int i = limit; i>=0;i--)
      {
         num=0;denom=0;
         for(int j=0;j<length;j++)
         {
            num=num+(1+j)*Calc_pr(i+j,is_median);
            denom=denom+Calc_pr(i+j,is_median);
         }
         if(denom!=0)
	      ind1[i]=-num/denom + (1+length)/2;
         ind2[i]=ind1[i+1];
       }

//----
   return(0);
  }

 double Calc_pr(int x,bool pricet)
 {
    double pr;
    if(pricet)
            {
               pr=(High[x]+Low[x])/2;

            }
            else
            {
               pr=(High[x]+Low[x]+Close[x])/3;
            }
  return(pr);
 }
//+------------------------------------------------------------------+
Comments