5_bar_reversal_v0[1][1].5
Download script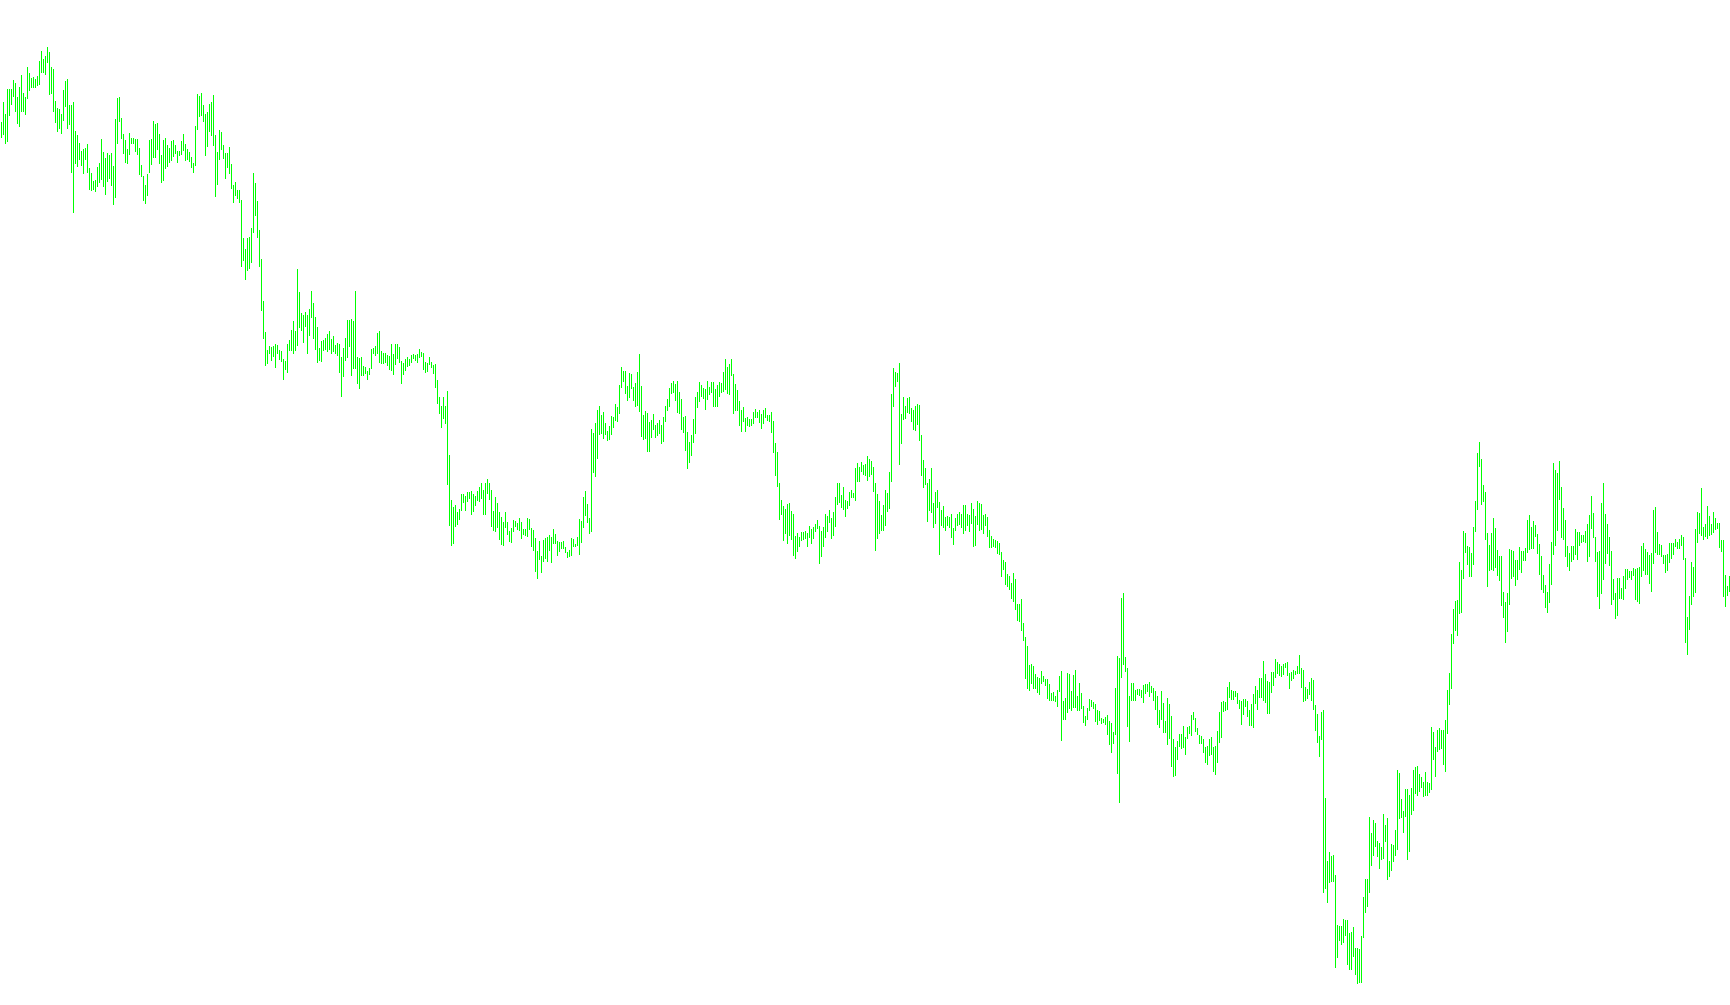
This script is designed as a visual tool for traders to identify specific price action patterns on a trading chart. Its primary goal is to highlight potential reversal points by comparing the current price movement against a historical window of data.
How the Logic Works
The indicator functions by scanning back through the market history, specifically looking at price movements over a 5-bar period. It analyzes four key components of the market: high prices, low prices, and closing prices. By comparing the relationship between these values across different timeframes within that window, the script identifies specific "breakout" or "reversal" signatures.
Key Mechanics:
- Historical Comparison: The logic looks at a current block of 5 bars and compares it to a preceding block of 5 bars. It tracks whether the highest point reached in the recent period is higher than the previous peak, and whether the lowest point reached is lower than the previous floor.
- Price Interaction: It checks where the current market price (the "close") sits in relation to those historical boundaries.
- Trend Reversal Detection: The script looks for specific imbalances between these two windows of time:
- Sell Signals: It identifies instances where the recent high is greater than the previous high, but the current closing price has dropped significantly below a previous low point.
- Buy Signals: Conversely, it looks for instances where the recent low is lower than the previous low, but the current closing price has risen above a previous high point.
Visual Representation
Instead of providing complex data tables, the script communicates these findings directly on your chart using visual icons:
- Red Arrows: These appear when the conditions for a potential downward move (Sell) are met. They are placed slightly above the candles to make them easily visible without cluttering the price action.
- Yellow Arrows: These appear when the conditions for a potential upward move (Buy) are met, appearing slightly below the candles.
By automating this comparison, the script helps traders filter out minor market noise and focus on moments where the price is making significant shifts relative to its recent history.
//+------------------------------------------------------------------+
//|                                                       5 Bars.mq4 |
//|                      Copyright © 2006, EvgeniX                   |
//|
//+------------------------------------------------------------------+
#property copyright "Copyright © 2006, EvgeniX"
#property link      "EvgeniX"
//----
#property indicator_chart_window
#property indicator_buffers 2
#property indicator_color1 Red
#property indicator_width1 3
#property indicator_color2 Yellow
#property indicator_width2 3
//---- buffers
double ExtMapBuffer1[];
double ExtMapBuffer2[];
double fhigh;
double flow;
double fclose;
double shigh;
double slow;
double sclose;
//+------------------------------------------------------------------+
//| Custom indicator initialization function                         |
//+------------------------------------------------------------------+
int init()
  {
//---- indicators
   SetIndexStyle(0,DRAW_ARROW,4);
   SetIndexArrow(0,218);
   SetIndexBuffer(0,ExtMapBuffer1);
   SetIndexEmptyValue(0,0.0);
   SetIndexStyle(1,DRAW_ARROW,4);
   SetIndexArrow(1,217);
   SetIndexBuffer(1,ExtMapBuffer2);
   SetIndexEmptyValue(1,0.0);
//----
   return(0);
  }
//+------------------------------------------------------------------+
//| Custor indicator deinitialization function                       |
//+------------------------------------------------------------------+
int deinit()
  {
//----
//----
   return(0);
  }
//+------------------------------------------------------------------+
//| Custom indicator iteration function                              |
//+------------------------------------------------------------------+
int start()
  {
   int    counted_bars=IndicatorCounted();
//----
   for(int i=1  ;i<=500;i++)
     {
      Comment (i);
      shigh=High[Highest(NULL, 0,2,5,i)];
      slow=Low[Lowest(NULL,0,1,5,i)];
      sclose=Close[i];
      fhigh=High[Highest(NULL, 0, 2, 5, (i+5))];
      flow=Low[Lowest(NULL,0,1,5,(i+5))];
      fclose=Close[i+9];
      //ExtMapBuffer2[i+5]=High[i]+0.0005;
      //ExtMapBuffer1[i]=High[i]+0.0005;
      if ((shigh>fhigh) && (sclose<flow))
        {
         ExtMapBuffer1[i+5]=High[i+5]+0.0005;
         // if (i==500)Alert ("5Bar Reverse  S E L L ", Symbol()," M",Period());
        }
      if ((slow<flow) && (sclose>fhigh))
        {
         ExtMapBuffer2[i+5]=Low[i+5]-0.0005;
         //  if (i==500) Alert ("5Bar Reverse  B U Y ", Symbol()," M",Period());
        }
      //     Comment(Close[i+4]+" "+" "+DoubleToStr(i,1)+"  "+TimeToStr(Time[i],TIME_MINUTES)+
      //     "\n"+" "+shigh+" "+slow+" "+sclose+
      //     "\n"+" "+fhigh+" "+flow+" "+fclose);
     }
//----
   return(0);
  }
//+------------------------------------------------------------------+
Comments