AbsoluteStrength TimeFrame_v1
Download script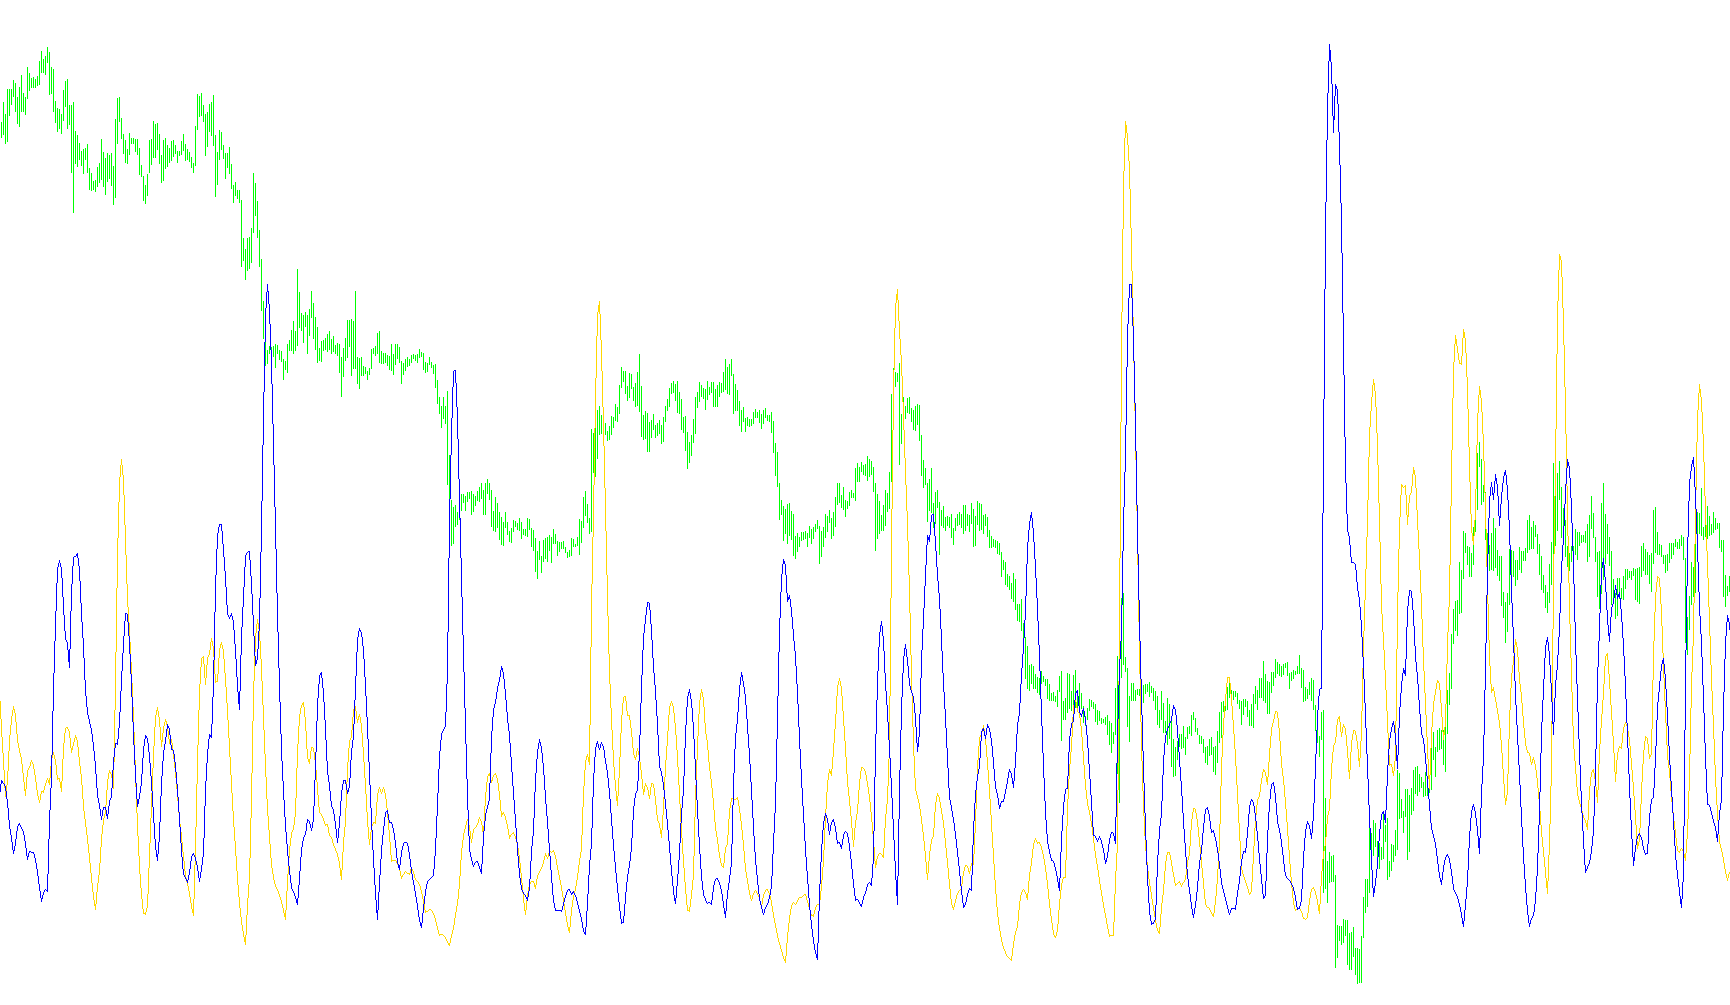
This tool is designed to measure and visualize market momentum by identifying the "strength" of buyers (Bulls) versus sellers (Bears) in real-time. It provides traders with a clearer picture of which side currently holds the upper hand in the market, helping to filter out noise and identify prevailing trends.
How the Logic Works
The script functions by evaluating price action through three distinct calculation modes. Depending on your preference, it interprets market strength in different ways:
- RSI Method: This mode focuses on the direction of price movement. It looks at the change between the current price and the previous price to determine if the momentum is moving upward or downward.
- Stochastic Method: This mode compares the current price against the highest highs and lowest lows over a specific period. It measures how far the price has traveled relative to its recent range, helping to identify if the market is reaching an extreme point.
- ADX Method: This mode focuses specifically on the volatility of high and low prices. It captures the "energy" behind price swings to distinguish between active movement and stagnant periods.
Data Processing and Smoothing
Once the raw strength for Bulls and Bears is calculated based on your chosen mode, the script performs a multi-layered refinement process:
- Averaging: The raw data is averaged over a set period to remove minor, insignificant price fluctuations.
- Smoothing: A second layer of smoothing is applied to the averages. This creates fluid, continuous lines that make it easier for traders to see the "flow" of the market rather than jagged, erratic movements.
- Signal Generation: Finally, the script calculates a Signal Line. This acts as a secondary reference point—similar to how a moving average interacts with price—allowing you to see changes in momentum and potential trend reversals more clearly.
Key Features for the Trader
- Multi-Timeframe Awareness: The logic allows you to view strength based on different timeframes, ensuring you can keep your analysis aligned with the broader market context.
- Customizable Inputs: You can adjust the length of evaluation (how much history the tool looks at), the level of smoothing (how "soft" or "reactive" the lines appear), and the specific price types (such as Close, Open, High, or Low) that drive the calculation.
- Overbought/Oversold Integration: The script includes a mechanism to recognize extreme market conditions. If you set specific levels for these boundaries, the signal lines will adjust to help highlight when a trend may be becoming overextended.
Indicators Used
Miscellaneous
12
Views
0
Downloads
0
Favorites
AbsoluteStrength TimeFrame_v1
/*-----------------------------+
|			       |
| Shared by www.Aptrafx.com    |
|			       |
+------------------------------*/

//+------------------------------------------------------------------+
//|                                   AbsoluteStrength TimeFrame.mq4 |
//|                      Copyright © 2006, MetaQuotes Software Corp. |
//|                                        http://www.metaquotes.net |
//+------------------------------------------------------------------+
#property copyright "Copyright © 2006, MetaQuotes Software Corp."
#property link      "http://www.metaquotes.net"
#property link      " TimeFrame & Data by cja"
//+------------------------------------------------------------------+
//|                                        AbsoluteStrength_v1.1.mq4 |
//|                           Copyright © 2006, TrendLaboratory Ltd. |
//|            http://finance.groups.yahoo.com/group/TrendLaboratory |
//|                                       E-mail: igorad2004@list.ru |
//+------------------------------------------------------------------+
#property copyright "Copyright © 2006, TrendLaboratory Ltd."
#property link      "http://finance.groups.yahoo.com/group/TrendLaboratory"

#property indicator_separate_window
#property indicator_buffers   4
#property indicator_color1    SteelBlue
//#property indicator_width1    2
#property indicator_color2    Silver//DarkSlateBlue
//#property indicator_width2    2
/*#property indicator_color3    Aqua
#property indicator_width3    1
#property indicator_style3    3
#property indicator_color4    Orange
#property indicator_width4    1
#property indicator_style4    3*/
//---- input parameters
extern double    TimeFrame   =  0;
extern int       Mode       =  0; // 0-RSI method; 1-Stoch method; 2-ADX method
extern int       Length     = 10; // Period of evaluation
extern int       Smooth     =  5; // Period of smoothing
extern int       Signal     =  5; // Period of Signal Line
extern int       Price      =  0; // Price mode : 0-Close,1-Open,2-High,3-Low,4-Median,5-Typical,6-Weighted
extern int       ModeMA     =  3; // Mode of Moving Average
extern double    OverBought =  0; // OverBought Level
extern double    OverSold   =  0; // OverSold Level


//---- buffers
double Bulls[];
double Bears[];
double AvgBulls[];
double AvgBears[];
double SmthBulls[];
double SmthBears[];
double SigBulls[];
double SigBears[];

//+------------------------------------------------------------------+
//| Custom indicator initialization function                         |
//+------------------------------------------------------------------+
int init()
  {

//---- indicators
   IndicatorBuffers(8);
   SetIndexStyle(0,DRAW_LINE);
   SetIndexBuffer(0,SmthBulls);
   SetIndexStyle(1,DRAW_LINE);
   SetIndexBuffer(1,SmthBears);
   //SetIndexStyle(2,DRAW_LINE);
   //SetIndexBuffer(2,SigBulls);
   //SetIndexStyle(3,DRAW_LINE);
   //SetIndexBuffer(3,SigBears);
   SetIndexBuffer(4,Bulls);
   SetIndexBuffer(5,Bears);
   SetIndexBuffer(6,AvgBulls);
   SetIndexBuffer(7,AvgBears);
//---- name for DataWindow and indicator subwindow label
   string short_name="AbsoluteStrength("+Symbol()+","+TimeFrame+")";
   IndicatorShortName(short_name);
   SetIndexLabel(0,"Bulls");
   SetIndexLabel(1,"Bears");
   SetIndexLabel(2,"SignalBulls");
   SetIndexLabel(3,"SignalBears");
//----
   SetIndexDrawBegin(0,Length+Smooth+Signal);
   SetIndexDrawBegin(1,Length+Smooth+Signal);
   SetIndexDrawBegin(2,Length+Smooth+Signal);
   SetIndexDrawBegin(3,Length+Smooth+Signal);

   return(0);
  }

//+------------------------------------------------------------------+
//| Custom indicator iteration function                              |
//+------------------------------------------------------------------+
int start()
  {

   int      shift, limit, counted_bars=IndicatorCounted();
   double   Price1, Price2, smax, smin;
//----
   if ( counted_bars < 0 ) return(-1);
   if ( counted_bars ==0 ) limit=Bars-Length+Smooth+Signal-1;
   if ( counted_bars < 1 )
   for(int i=1;i<Length+Smooth+Signal;i++)
   {
   Bulls[Bars-i]=0;
   Bears[Bars-i]=0;
   AvgBulls[Bars-i]=0;
   AvgBears[Bars-i]=0;
   SmthBulls[Bars-i]=0;
   SmthBears[Bars-i]=0;
   SigBulls[Bars-i]=0;
   SigBears[Bars-i]=0;
   }


   if(counted_bars>0) limit=Bars-counted_bars;
   limit--;

   for( shift=limit; shift>=0; shift--)
      {
      Price1 = iMA(NULL,TimeFrame ,1,0,0,Price,shift);
      Price2 = iMA(NULL,TimeFrame ,1,0,0,Price,shift+1);

         if (Mode==0)
         {
         Bulls[shift] = 0.5*(MathAbs(Price1-Price2)+(Price1-Price2));
         Bears[shift] = 0.5*(MathAbs(Price1-Price2)-(Price1-Price2));
         }

         if (Mode==1)
         {
         smax=High[Highest(NULL,TimeFrame ,MODE_HIGH,Length,shift)];
         smin=Low[Lowest(NULL,TimeFrame ,MODE_LOW,Length,shift)];

         Bulls[shift] = Price1 - smin;
         Bears[shift] = smax - Price1;
         }

         if (Mode==2)
         {
         Bulls[shift] = 0.5*(MathAbs(High[shift]-High[shift+1])+(High[shift]-High[shift+1]));
         Bears[shift] = 0.5*(MathAbs(Low[shift+1]-Low[shift])+(Low[shift+1]-Low[shift]));
         }


      }

      for( shift=limit; shift>=0; shift--)
      {
      AvgBulls[shift]=iMAOnArray(Bulls,0,Length,0,ModeMA,shift);
      AvgBears[shift]=iMAOnArray(Bears,0,Length,0,ModeMA,shift);
      }

      for( shift=limit; shift>=0; shift--)
      {
      SmthBulls[shift]=iMAOnArray(AvgBulls,0,Smooth,0,ModeMA,shift);
      SmthBears[shift]=iMAOnArray(AvgBears,0,Smooth,0,ModeMA,shift);
      }

      for( shift=limit; shift>=0; shift--)
      {
         if (OverBought > 0 && OverSold > 0 )
         {
         SigBulls[shift]=OverBought/100*(SmthBulls[shift]+SmthBears[shift]);
         SigBears[shift]=OverSold/100*(SmthBulls[shift]+SmthBears[shift]);
         }
         else
         {
         SigBulls[shift]=iMAOnArray(SmthBulls,0,Signal,0,ModeMA,shift);
         SigBears[shift]=iMAOnArray(SmthBears,0,Signal,0,ModeMA,shift);
         }
      }
//----
   return(0);
  }
//+------------------------------------------------------------------+
Comments